3,837
Views
38
CrossRef citations to date
0
Altmetric
Original Research

Long-lived pancreatic ductal adenocarcinoma slice cultures enable precise study of the immune microenvironment

, , , , , , , , & show all
Article: e1333210 | Received 28 Dec 2016, Accepted 17 May 2017, Published online: 11 Jul 2017

Figures & data

Table 1. Overview of patient demographics.

Figure 1. The procedure flowchart for tumor slice culture. Human tumor tissue is transported in ice-cold 10% FBS RPMI 1640 media with 1% penicillin and streptomycin from the operating room to the laboratory and cut into 250-μm slices in buffer solution using a vibratome. The slices are transferred to culture medium and then carefully placed on membrane inserts in 6- or 24-well plates to create an air–liquid interface. The slices are cultured in vitro for survival and cytotoxic assays, architectural characterization identification and immunohistochemistry, as well as live immune-fluorescence imaging.

Figure 1. The procedure flowchart for tumor slice culture. Human tumor tissue is transported in ice-cold 10% FBS RPMI 1640 media with 1% penicillin and streptomycin from the operating room to the laboratory and cut into 250-μm slices in buffer solution using a vibratome. The slices are transferred to culture medium and then carefully placed on membrane inserts in 6- or 24-well plates to create an air–liquid interface. The slices are cultured in vitro for survival and cytotoxic assays, architectural characterization identification and immunohistochemistry, as well as live immune-fluorescence imaging.

Figure 2. PDA tumor slices maintain morphology and surface area for over a week in culture. (A) PDA slices were cultured for up to 9 d, with fresh media changes performed every 2–3 d. Bar = 500 μm. (N = 3) (B) Surface area (mm2) of each slice was measured by analyzing photographs with Fiji Image J. There were no significant differences in surface area among days 1, 3, 6, and 9. (N = 3) Error bars represent STDEV.
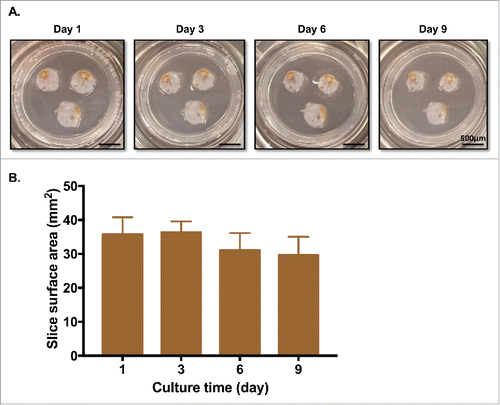
Figure 2. PDA tumor slices maintain morphology and surface area for over a week in culture. (A) PDA slices were cultured for up to 9 d, with fresh media changes performed every 2–3 d. Bar = 500 μm. (N = 3) (B) Surface area (mm2) of each slice was measured by analyzing photographs with Fiji Image J. There were no significant differences in surface area among days 1, 3, 6, and 9. (N = 3) Error bars represent STDEV.

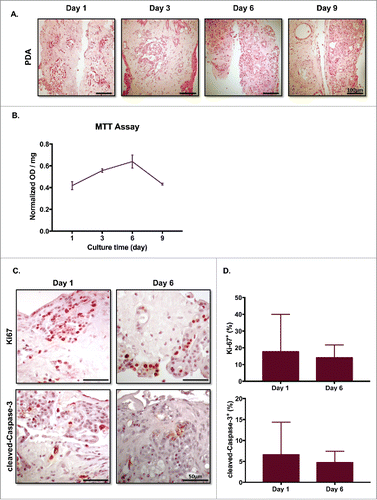
Figures 3. Slice cultures preserve the overall tumor microenvironment. (A) Slice tissues maintain their architecture through their entire thickness. PDA slices were harvested on the indicated days, fixed and embedded in paraffin. The slices were cut vertically, stained with H&E, and imaged using brightfield microscopy. Bar = 100 μm. (N = 4) (B) MTT assay showed minimal changes over the culture periods. (N = 3) (C) PDA slices were stained with antibodies to Ki-67 and cleaved-Caspase-3 on days 1 and 6. Bar = 50 μm. (N = 3) (D) Quantification of each marker's expression demonstrated similar levels of cellular proliferation and apoptosis at both time points. (N = 2) Error bars represent STDEV.
Figures 3. Slice cultures preserve the overall tumor microenvironment. (A) Slice tissues maintain their architecture through their entire thickness. PDA slices were harvested on the indicated days, fixed and embedded in paraffin. The slices were cut vertically, stained with H&E, and imaged using brightfield microscopy. Bar = 100 μm. (N = 4) (B) MTT assay showed minimal changes over the culture periods. (N = 3) (C) PDA slices were stained with antibodies to Ki-67 and cleaved-Caspase-3 on days 1 and 6. Bar = 50 μm. (N = 3) (D) Quantification of each marker's expression demonstrated similar levels of cellular proliferation and apoptosis at both time points. (N = 2) Error bars represent STDEV.

Figure 4. The majority of identified immunologic proteins remain stable over 6 d of slice culture. Duplicate PDA slices before and after 6 d of culture were analyzed by proteomics and compared. (A) Correlation of abundance of immunologic proteins annotated by ImmPort before and after 6 d of slice culture. (B) Volcano plot of the immunologic proteins before and after 6 d of slice culture. Proteins with a p-value ≤ 0.01 and an abundance change ≥ 2-fold are considered to have significant changes after 6 d in culture (N = 2).
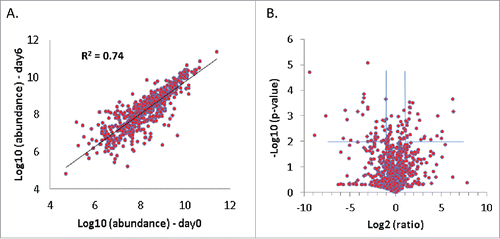
Figure 4. The majority of identified immunologic proteins remain stable over 6 d of slice culture. Duplicate PDA slices before and after 6 d of culture were analyzed by proteomics and compared. (A) Correlation of abundance of immunologic proteins annotated by ImmPort before and after 6 d of slice culture. (B) Volcano plot of the immunologic proteins before and after 6 d of slice culture. Proteins with a p-value ≤ 0.01 and an abundance change ≥ 2-fold are considered to have significant changes after 6 d in culture (N = 2).

Figure 5. Immune and stromal cells survive in slice culture. IHC for (A) T cell markers (CD3, CD8+, and FOXP3) (N = 3) and (B) macrophage markers (CD68, HLA-DR and CD163) was performed on days 1 and 6 of PDA slice cultures (all Bar = 50 μm). (N = 3) (C) Quantitation of cells staining for each marker demonstrates stability of immune cell populations. (N = 3) Error bars represent STDEV. (D) Day 1 and 6 slices were stained with α smooth muscle actin (αSMA) (Bar = 100 μm). (N = 4) The right panels are the expanded views of the region of interest indicated by the black boxes in the left panels.
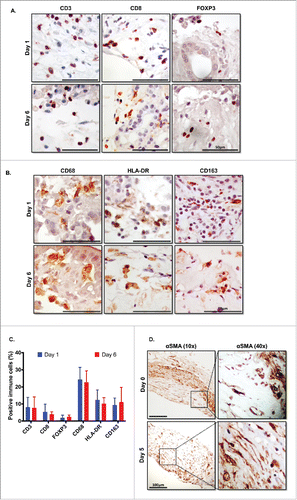
Figure 5. Immune and stromal cells survive in slice culture. IHC for (A) T cell markers (CD3, CD8+, and FOXP3) (N = 3) and (B) macrophage markers (CD68, HLA-DR and CD163) was performed on days 1 and 6 of PDA slice cultures (all Bar = 50 μm). (N = 3) (C) Quantitation of cells staining for each marker demonstrates stability of immune cell populations. (N = 3) Error bars represent STDEV. (D) Day 1 and 6 slices were stained with α smooth muscle actin (αSMA) (Bar = 100 μm). (N = 4) The right panels are the expanded views of the region of interest indicated by the black boxes in the left panels.

Figure 6. Dose- and time-dependent responses with drug treatment. (A) Effect of staurosporine (STS) on slice cell apoptosis. PDA slices were treated with vehicle or 1 µm STS for 48 h after one day culture. Slices were stained with antibodies Ki67 and cleaved-Caspase-3 at original tumor slice (day 0) and control and 1-μM STS 48 h treatment at day 3 culture. Bar = 50 μm. (N = 3) (B) Graphs show the percentages of Ki-67+ cells and cleaved-Caspase-3+ cells of total counted cells at day 0, day 3 control and 1-μM STS treatment of 48 h. Total cell nuclei numbers were counted for each condition. (N = 3) (C) Time-dependent response with STS treatment. Appearance of cleaved-Caspase-3+ cells following treatment of PDA slices with 1-μM STS for 6 or 24 h. Bar = 50 μm. Error bars represent STDEV. (N = 2) (D) Dose-dependent response with STS and cycloheximide (CHX) treatment. Appearance of cleaved-Caspase-3+ cells following treatment of PDA slices with 2 μM and 10 μM STS or 10 μg/mL and 50 μg/mL CHX for 6 h. Bar = 50 μm. Error bars represent STDEV. p-values are as follows: p < 0.05; **p < 0.005; ***p < 0.001. (N = 2).
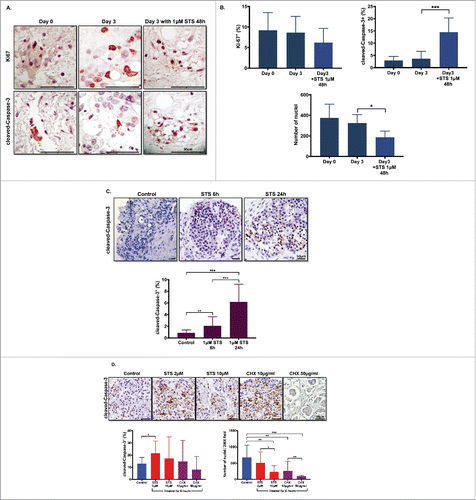
Figure 6. Dose- and time-dependent responses with drug treatment. (A) Effect of staurosporine (STS) on slice cell apoptosis. PDA slices were treated with vehicle or 1 µm STS for 48 h after one day culture. Slices were stained with antibodies Ki67 and cleaved-Caspase-3 at original tumor slice (day 0) and control and 1-μM STS 48 h treatment at day 3 culture. Bar = 50 μm. (N = 3) (B) Graphs show the percentages of Ki-67+ cells and cleaved-Caspase-3+ cells of total counted cells at day 0, day 3 control and 1-μM STS treatment of 48 h. Total cell nuclei numbers were counted for each condition. (N = 3) (C) Time-dependent response with STS treatment. Appearance of cleaved-Caspase-3+ cells following treatment of PDA slices with 1-μM STS for 6 or 24 h. Bar = 50 μm. Error bars represent STDEV. (N = 2) (D) Dose-dependent response with STS and cycloheximide (CHX) treatment. Appearance of cleaved-Caspase-3+ cells following treatment of PDA slices with 2 μM and 10 μM STS or 10 μg/mL and 50 μg/mL CHX for 6 h. Bar = 50 μm. Error bars represent STDEV. p-values are as follows: p < 0.05; **p < 0.005; ***p < 0.001. (N = 2).

Figure 7. Multicolor immunofluorence images of live-stained culture slices. (A) PDA slices were stained with 10 μg/mL of Alexa Fluro 488 CD8 and Alexa Fluor 594 EpCAM (CD326) (N = 2) or (B) 10 μg/mL of Alexa Fluro 488 fibronectin and Alexa Fluor 594 CD11b antibodies for 3 h, followed by Hoechst 33342 nuclear stain for 5 min. Slices were then fixed and imaged by confocal microscopy. Bar = 50 μm. (N = 2) (C) The PDA slices of (A) and (B) were subjected to Z serial stack imaging (2 μm/stack) by confocal microscopy and were visualized in Volume views by Imaris software and Fiji Image J. Left panel, CD8+ (green), EpCAM+ (CD326) (red); right panel, fibronectin+ (green) and CD11b+ (red) and nuclei stain (blue) stained cells. Bar = 100 μm. (N = 2).
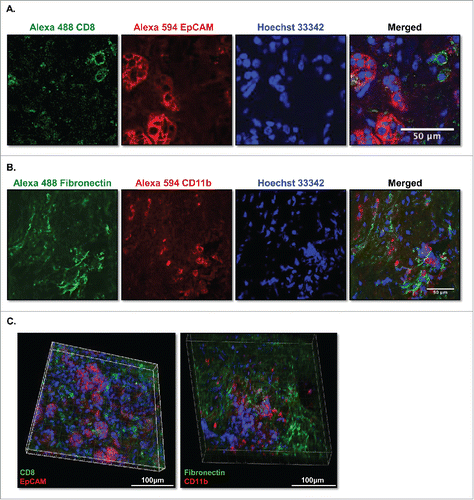
Figure 7. Multicolor immunofluorence images of live-stained culture slices. (A) PDA slices were stained with 10 μg/mL of Alexa Fluro 488 CD8 and Alexa Fluor 594 EpCAM (CD326) (N = 2) or (B) 10 μg/mL of Alexa Fluro 488 fibronectin and Alexa Fluor 594 CD11b antibodies for 3 h, followed by Hoechst 33342 nuclear stain for 5 min. Slices were then fixed and imaged by confocal microscopy. Bar = 50 μm. (N = 2) (C) The PDA slices of (A) and (B) were subjected to Z serial stack imaging (2 μm/stack) by confocal microscopy and were visualized in Volume views by Imaris software and Fiji Image J. Left panel, CD8+ (green), EpCAM+ (CD326) (red); right panel, fibronectin+ (green) and CD11b+ (red) and nuclei stain (blue) stained cells. Bar = 100 μm. (N = 2).

Figure 8. CFSE-labeled human slpenocytes migrate into live PDA slices. Isolated single-cell suspensions of autologous splenocytes (1×10⁶) from a PDA patient were labeled with 1-μM CFSE and were added to tumor slice cultures on day 2 of culture. After 6 additional days of co-culture, the slices nuclei were stained with Hoechst 33342 (blue), fixed with 4% paraformaldehyde, and imaged by confocal microscopy with Z series stack image capture (2 μm/stack). Bar = 100 μm. (N = 2).
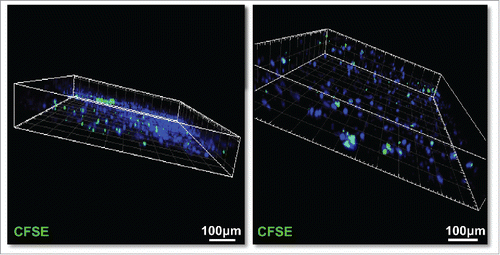
Figure 8. CFSE-labeled human slpenocytes migrate into live PDA slices. Isolated single-cell suspensions of autologous splenocytes (1×10⁶) from a PDA patient were labeled with 1-μM CFSE and were added to tumor slice cultures on day 2 of culture. After 6 additional days of co-culture, the slices nuclei were stained with Hoechst 33342 (blue), fixed with 4% paraformaldehyde, and imaged by confocal microscopy with Z series stack image capture (2 μm/stack). Bar = 100 μm. (N = 2).
Supplemental material

Supplemental_materials.zip

Download Zip (1.2 MB)