Figures & data
Table 1. Patient characteristics (n = 19).
Table 2. Heterogeneous expression of checkpoint molecules on tumor cells and/or tumor-infiltrating T cells.
Table 3. Characteristics of patients #2, #7, #8 and #10.
Figure 1. Representative dot plots of the results obtained by flow cytometry analysis for ILT2 cell-surface expression on CD8+ and CD4+ T cells from PBMC and 3 different tumor areas in patient #7 are shown. Tumor-infiltrating cells were obtained after mechanic disruption followed by enzymatic digestion of 3 different areas from the surgically-resected tumor (T1, T2, T3). PBMC and tumor infiltrating cells from each tumor area were stained with conjugated-antibodies directed against CD3, CD4, CD8, and ILT2 and were then analyzed by flow cytometry. Percentages of both ILT2-positive and ILT2-negative populations gated on CD3+ T cells are indicated.
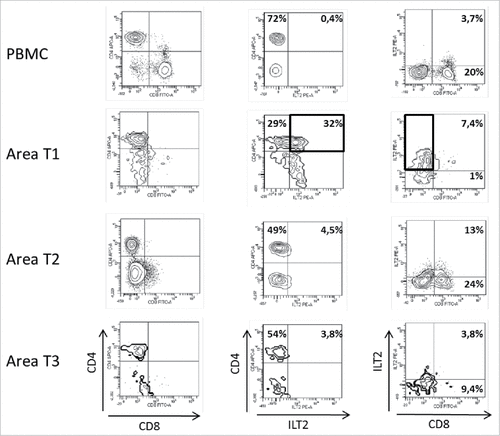
Figure 2. Representative dot plots of the results obtained by flow cytometry analysis for ILT2 cell-surface expression on CD8+ and CD4+ T cells from PBMC and 4 different tumor areas in patient #8 are shown. Tumor-infiltrating cells were obtained after mechanic disruption followed by enzymatic digestion of 4 different areas from the surgically-resected tumor (T1, T2, G, VT). PBMC and tumor infiltrating cells from each tumor area were stained with conjugated-antibodies directed against CD3, CD4, CD8, and ILT2 and were then analyzed by flow cytometry. Percentages of both ILT2-positive and ILT2-negative populations gated on CD3+ T cells are indicated. G, metastatic hilar lymph node; VT, tumoral thrombus of the renal vein
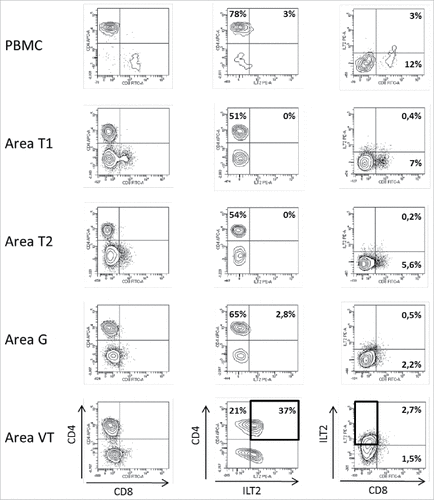
Figure 3. Representative staining obtained by immunohistochemistry analysis for CD3, CD8, CD4, PDL1 and HLA-G expression in tumor biopsy from patient #8 are shown. Formalin-fixed tumor tissue sections from the tumoral thrombus of the renal vein were stained with antibody directed either against CD3, CD8, CD4, PDL1 or HLA-G marker. Brown labeling indicates marker positivity. Scale bar is indicated.
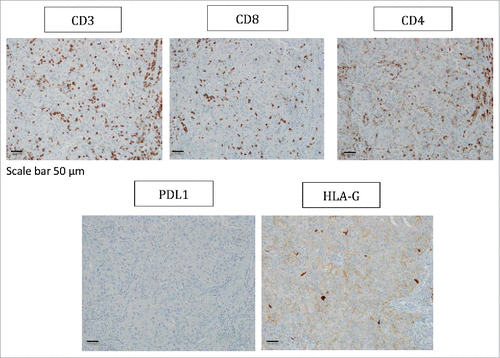
Figure 4. Representative histograms obtained by flow cytometry analysis for CA9 and HLA-G cell-surface expression on tumor cells from 4 different tumor areas in patient #2 are shown. Tumor cells were obtained after mechanic disruption followed by enzymatic digestion of 4 different areas from the surgically-resected tumor (T1, T2, T3, T4). Cells were then cultured for 3 d and then stained with antibody either directed against CD3, CD45, HLA-G or CA9 marker. Tumor cells were considered to be large CD45-negative and CD3-negative cells (data not shown). Percentage of the HLA-G-positive population in CD3− CD45− gated cells is indicated. Blue and red histograms correspond to staining with isotype control and marker, respectively.
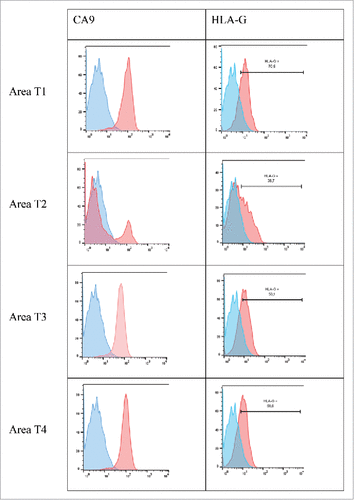
Figure 5. Representative staining obtained by immunohistochemistry analysis for PDL1 and HLA-G expression in tumor area (T1) from patient #2 is shown. Formalin-fixed tumor tissue sections from the tumor area T1 were stained with antibody directed either against PDL1 or HLA-G marker. Brown labeling indicates marker positivity. HLA-G staining is observed in the cytoplasm of tumor cells but also in intracellular and extracellular vesicles. Scale bars are indicated.
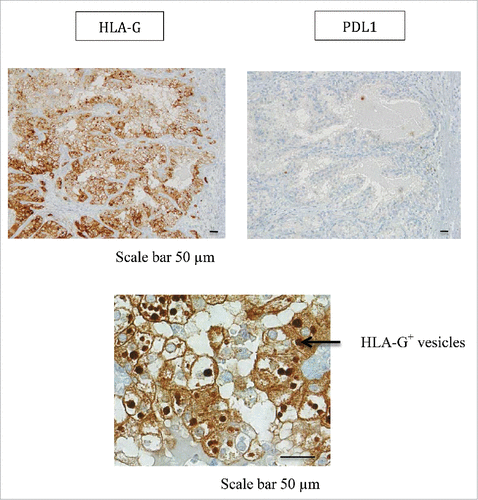
Figure 6. Representative histograms obtained by flow cytometry analysis for PDL1 and ILT4 cell-surface expression on cells from the normal adjacent tissue or on tumor cells from 3 different tumor areas in patient #10 are shown. Cells were obtained after mechanic disruption followed by enzymatic digestion of either the normal adjacent tissue or 3 different areas from the surgically-resected tumor (T1,T3, VT). Cells were then cultured for 3 d and then stained with antibody either directed against CD3, CD45, PDL1 or ILT4 marker. Tumor cells were considered to be large CD45-negative and CD3-negative cells (data not shown). Percentage of the HLA-G-positive population in CD3- CD45- gated cells is indicated. Blue and red histograms correspond to staining with isotype control and marker, respectively. VT, tumoral thrombus of the renal vein.
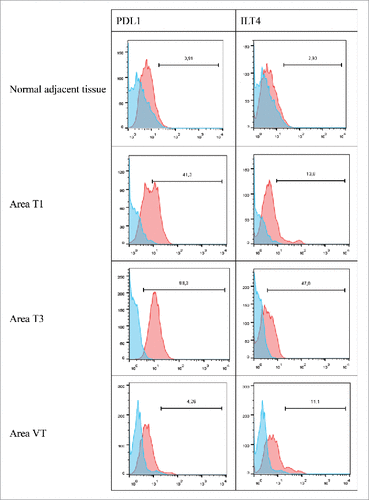
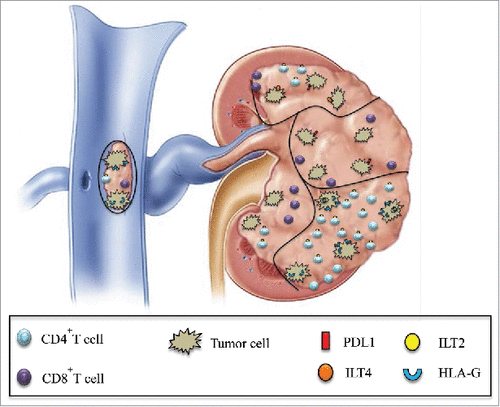
Figure 7. Schematic representation of the simultaneous expression of various immune checkpoints in different tumor areas is shown. Intratumor heterogeneity of PD1/PDL1 and HLA-G/ILT expression in various areas of the same tumor, including the tumoral thrombus of the renal vein, can be observed both at tumor cell and infiltrating CD4+ and CD8+ T cell levels.