2,433
Views
50
CrossRef citations to date
0
Altmetric
Original Research

PD-1 blockade augments anti-neuroblastoma immune response induced by anti-GD2 antibody ch14.18/CHO

, , ORCID Icon, ORCID Icon & ORCID Icon
Article: e1343775 | Received 10 May 2017, Accepted 12 Jun 2017, Published online: 28 Jul 2017

Figures & data

Figure 1. PD-L1 gene expression by NB- and effector cells. (A-B) Representative RT-PCR (A) and densitometric analysis of PD-L1 mRNA (B) by human NB cell lines CHLA-20, LA-N-1, LA-N-6 and SK-N-SH as well as by primary cell lines HGW-1, HGW-2, HGW-3, and HGW-5. PD-L1 mRNA Expression (A, upper panel) was evaluated relative to GAPDH (A, lower panel) which served as internal control according to the formula: PD-L1 signal intensity/GAPDH signal intensity. (B) Values are given as means ± SEM of 5 independent experiments. (C) Representative histograms and (D) flow cytometry analysis of PD-L1 baseline expression by NB cells LA-N-1 (C, upper left panel) and leukocytes (granulocytes (C, upper right panel), monocytes (C, lower left panel) and lymphocytes (C, lower right panel)). Cells were stained with PE-labeled anti-mouse PD-L1 Ab (filled black curve). Anti-mouse IgG2b, κ-PE was used as isotype control (open gray curve). The PD-L1 expression level was quantified using relative geometric mean fluorescence intensity (rgMFI) according to the formula: MFI of PD-L1 stained sample/MFI of isotype control. When the control histogram (isotype control) is not visible it is covered by the experimental histogram (PD-L1 staining). Data are shown as mean values ± SEM of at least 3 independent experiments.
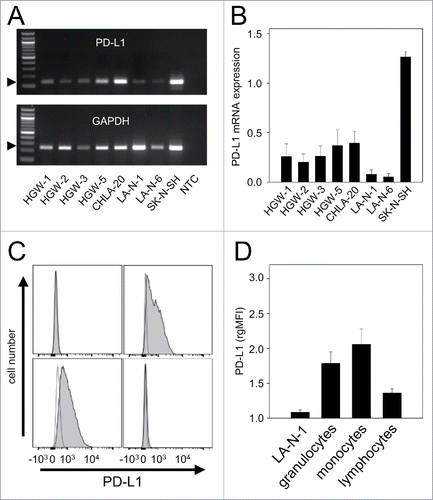
Figure 1. PD-L1 gene expression by NB- and effector cells. (A-B) Representative RT-PCR (A) and densitometric analysis of PD-L1 mRNA (B) by human NB cell lines CHLA-20, LA-N-1, LA-N-6 and SK-N-SH as well as by primary cell lines HGW-1, HGW-2, HGW-3, and HGW-5. PD-L1 mRNA Expression (A, upper panel) was evaluated relative to GAPDH (A, lower panel) which served as internal control according to the formula: PD-L1 signal intensity/GAPDH signal intensity. (B) Values are given as means ± SEM of 5 independent experiments. (C) Representative histograms and (D) flow cytometry analysis of PD-L1 baseline expression by NB cells LA-N-1 (C, upper left panel) and leukocytes (granulocytes (C, upper right panel), monocytes (C, lower left panel) and lymphocytes (C, lower right panel)). Cells were stained with PE-labeled anti-mouse PD-L1 Ab (filled black curve). Anti-mouse IgG2b, κ-PE was used as isotype control (open gray curve). The PD-L1 expression level was quantified using relative geometric mean fluorescence intensity (rgMFI) according to the formula: MFI of PD-L1 stained sample/MFI of isotype control. When the control histogram (isotype control) is not visible it is covered by the experimental histogram (PD-L1 staining). Data are shown as mean values ± SEM of at least 3 independent experiments.

Figure 2. Effects of ADCC culture conditions on PD-L1 expression by NB cells. PD-L1 expression was analyzed on LA-N-1 cells by flow cytometry and data are shown by representative histograms (A-C) and rgMFI values (D) as described in Materials and Methods. Results show PD-L1 expression after 24 h incubation with ch14.18/CHO (A), ch14.18/CHO in combination with leukocytes (ADCC conditions, B) and ch14.18/CHO with leukocytes and anti-idiotype ganglidiomab (anti-Id) (specificity control, C). When the control histogram (isotype control) is not visible it is covered by the experimental histogram (PD-L1 staining). The effect of ADCC conditions on PD-L1 expression was also analyzed in the presence of IL-2 (D). Cells were stained with PE-labeled anti-human PD-L1 Ab. To distinguish between PD-L1-positive NB cells (PD-L1+/GD2+/CD45) and leukocytes (PD-L1+/GD2/CD45+), Alexa647-labeled anti-GD2 and PE/Cy7-labeled anti-CD45 mAb were used. The PD-L1 expression level was quantified using relative geometric mean fluorescence intensity (rgMFI) according to the formula: MFI of PD-L1 by treated cells - MFI of PD-L1 by the respective untreated control. Ch14.18/CHO and rituximab served as controls. Data represent mean values ± SEM of at least 3 independent experiments. t-test, ##P < 0.01 vs. ch14.18/CHO, ###P < 0.001 vs. leukocytes, §§§P <0.001 vs. ADCC without IL-2, *P < 0.05 vs. ADCC without IL-2, **P < 0.01 vs. leukocytes, ***P < 0.001 vs. LA-N-1 incubated with IL-2.
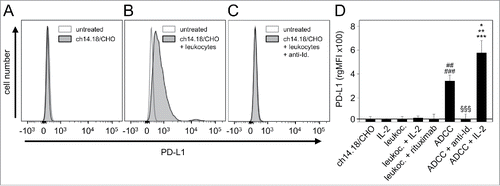
Figure 2. Effects of ADCC culture conditions on PD-L1 expression by NB cells. PD-L1 expression was analyzed on LA-N-1 cells by flow cytometry and data are shown by representative histograms (A-C) and rgMFI values (D) as described in Materials and Methods. Results show PD-L1 expression after 24 h incubation with ch14.18/CHO (A), ch14.18/CHO in combination with leukocytes (ADCC conditions, B) and ch14.18/CHO with leukocytes and anti-idiotype ganglidiomab (anti-Id) (specificity control, C). When the control histogram (isotype control) is not visible it is covered by the experimental histogram (PD-L1 staining). The effect of ADCC conditions on PD-L1 expression was also analyzed in the presence of IL-2 (D). Cells were stained with PE-labeled anti-human PD-L1 Ab. To distinguish between PD-L1-positive NB cells (PD-L1+/GD2+/CD45−) and leukocytes (PD-L1+/GD2−/CD45+), Alexa647-labeled anti-GD2 and PE/Cy7-labeled anti-CD45 mAb were used. The PD-L1 expression level was quantified using relative geometric mean fluorescence intensity (rgMFI) according to the formula: MFI of PD-L1 by treated cells - MFI of PD-L1 by the respective untreated control. Ch14.18/CHO and rituximab served as controls. Data represent mean values ± SEM of at least 3 independent experiments. t-test, ##P < 0.01 vs. ch14.18/CHO, ###P < 0.001 vs. leukocytes, §§§P <0.001 vs. ADCC without IL-2, *P < 0.05 vs. ADCC without IL-2, **P < 0.01 vs. leukocytes, ***P < 0.001 vs. LA-N-1 incubated with IL-2.

Figure 3. Effects of ADCC culture conditions on PD-L1 expression by 3 leukocytes populations: granulocytes (A), monocytes (B) and lymphocytes (C). Leukocytes were cultured for 24 h before analysis with ch14.18/CHO (10 ng/ml) and LA-N-1 NB cells (E:T 10:1) in the absence or presence of IL-2 (100 IU/ml). PD-L1 expression was analyzed by flow cytometry using PE-labeled anti-human PD-L1. Alexa647-labeled anti-GD2 and PE/Cy7-labeled anti-CD45 mAb were used to distinguish between NB cells (PD-L1+/GD2+/CD45) and leukocytes (PD-L1+/GD2/CD45+). PD-L1 expression level was quantified using the relative geometric mean fluorescence intensity (rgMFI) according to the formula: MFI of PD-L1 by treated cells - MFI of PD-L1 by the respective untreated control. Leukocytes incubated only with ch14.18/CHO, NB cells or IL-2 served as controls. To show GD2-specificity, ch14.18/CHO was replaced by rituximab or bound by ganglidiomab (anti-Id. of ch14.18/CHO) that was added to the ADCC culture condition. Data are shown as mean values ± SEM of at least 3 independent experiments. (A) t-test, ***P < 0.001 vs. ch14.18/CHO, §§P < 0.01 vs. ADDC, ##P < 0.01 vs. ch14.18/CHO and NB cells, ###P < 0.001 vs. rituximab, $$$P < 0.001 vs. granulocytes with IL-2 and NB cells with IL-2. (B) t-test, *P < 0.05 vs. ch14.18/CHO, ***P < 0.001 vs. NB cells and rituximab, §§P < 0.01 vs. ADCC, #P < 0.05 vs. ch14.18/CHO, ##P < 0.01 vs. NB cells, ###P < 0.001 vs. rituximab, $P < 0.05 vs. NB cells with IL-2, $$P < 0.01 vs. monocytes with IL-2. (C) t-test, *P < 0.05 vs. ch14.18/CHO, ***P < 0.001 vs. rituximab, ##P < 0.01 vs. ch14.18/CHO, NB cells and ADCC, ###P < 0.001 vs. rituximab and ADCC + anti-Id.
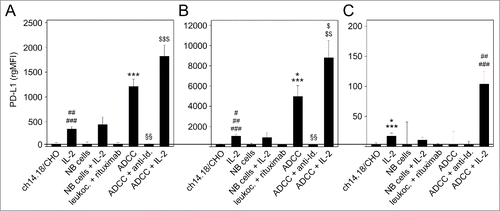
Figure 3. Effects of ADCC culture conditions on PD-L1 expression by 3 leukocytes populations: granulocytes (A), monocytes (B) and lymphocytes (C). Leukocytes were cultured for 24 h before analysis with ch14.18/CHO (10 ng/ml) and LA-N-1 NB cells (E:T 10:1) in the absence or presence of IL-2 (100 IU/ml). PD-L1 expression was analyzed by flow cytometry using PE-labeled anti-human PD-L1. Alexa647-labeled anti-GD2 and PE/Cy7-labeled anti-CD45 mAb were used to distinguish between NB cells (PD-L1+/GD2+/CD45−) and leukocytes (PD-L1+/GD2−/CD45+). PD-L1 expression level was quantified using the relative geometric mean fluorescence intensity (rgMFI) according to the formula: MFI of PD-L1 by treated cells - MFI of PD-L1 by the respective untreated control. Leukocytes incubated only with ch14.18/CHO, NB cells or IL-2 served as controls. To show GD2-specificity, ch14.18/CHO was replaced by rituximab or bound by ganglidiomab (anti-Id. of ch14.18/CHO) that was added to the ADCC culture condition. Data are shown as mean values ± SEM of at least 3 independent experiments. (A) t-test, ***P < 0.001 vs. ch14.18/CHO, §§P < 0.01 vs. ADDC, ##P < 0.01 vs. ch14.18/CHO and NB cells, ###P < 0.001 vs. rituximab, $$$P < 0.001 vs. granulocytes with IL-2 and NB cells with IL-2. (B) t-test, *P < 0.05 vs. ch14.18/CHO, ***P < 0.001 vs. NB cells and rituximab, §§P < 0.01 vs. ADCC, #P < 0.05 vs. ch14.18/CHO, ##P < 0.01 vs. NB cells, ###P < 0.001 vs. rituximab, $P < 0.05 vs. NB cells with IL-2, $$P < 0.01 vs. monocytes with IL-2. (C) t-test, *P < 0.05 vs. ch14.18/CHO, ***P < 0.001 vs. rituximab, ##P < 0.01 vs. ch14.18/CHO, NB cells and ADCC, ###P < 0.001 vs. rituximab and ADCC + anti-Id.

Figure 4. Effects of ADCC culture conditions on PD-1 expression by LA-N-1 NB cells (A) and 3 leukocytes populations: granulocytes (B), monocytes (C) and lymphocytes (D). ADCC was induced by 24 h incubation of LA-N-1 with ch14.18/CHO and leukocytes in the presence or absence of IL-2. PD-1 expression was analyzed by flow cytometry with PE-labeled anti-human PD-1 Ab. Alexa647-labeled anti-GD2 and PE/Cy7-labeled anti-CD45 mAb were used to distinguish between NB cells (GD2+/CD45) and leukocytes (GD2/CD45+). PD-1 expression level was determined using relative geometric mean fluorescence intensity (rgMFI) according to the formula: MFI of PD-1 by treated cells - MFI of PD-1 by the respective untreated control. Ch14.18/CHO, IL-2, leukocytes and NB cells, respectively, served as controls. To show GD2-specificity of ADCC, ch14.18/CHO was replaced by rituximab or bound by ganglidiomab (anti-Id of ch14.18/CHO) that was added to the ADCC culture condition. Data are shown as mean values ± SEM of at least 3 independent experiments. (C) *P <0.05 vs. ch14.18/CHO, §§P <0.01 vs. NB cells, ***P < 0.001 vs. ch14.18/CHO, #P < 0.05 vs. monocytes with IL-2, ###P < 0.001 vs. monocytes with IL-2. (D) *P < 0.05 vs. ch14.18/CHO, **P < 0.01 vs. ch14.18/CHO, #P < 0.05 vs. lymphocytes with IL-2, ##P < 0.01 vs. ch14.18/CHO.
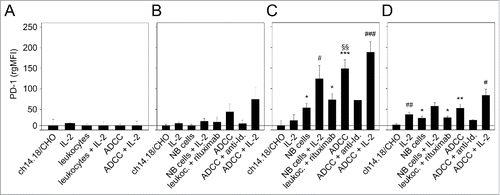
Figure 4. Effects of ADCC culture conditions on PD-1 expression by LA-N-1 NB cells (A) and 3 leukocytes populations: granulocytes (B), monocytes (C) and lymphocytes (D). ADCC was induced by 24 h incubation of LA-N-1 with ch14.18/CHO and leukocytes in the presence or absence of IL-2. PD-1 expression was analyzed by flow cytometry with PE-labeled anti-human PD-1 Ab. Alexa647-labeled anti-GD2 and PE/Cy7-labeled anti-CD45 mAb were used to distinguish between NB cells (GD2+/CD45−) and leukocytes (GD2−/CD45+). PD-1 expression level was determined using relative geometric mean fluorescence intensity (rgMFI) according to the formula: MFI of PD-1 by treated cells - MFI of PD-1 by the respective untreated control. Ch14.18/CHO, IL-2, leukocytes and NB cells, respectively, served as controls. To show GD2-specificity of ADCC, ch14.18/CHO was replaced by rituximab or bound by ganglidiomab (anti-Id of ch14.18/CHO) that was added to the ADCC culture condition. Data are shown as mean values ± SEM of at least 3 independent experiments. (C) *P <0.05 vs. ch14.18/CHO, §§P <0.01 vs. NB cells, ***P < 0.001 vs. ch14.18/CHO, #P < 0.05 vs. monocytes with IL-2, ###P < 0.001 vs. monocytes with IL-2. (D) *P < 0.05 vs. ch14.18/CHO, **P < 0.01 vs. ch14.18/CHO, #P < 0.05 vs. lymphocytes with IL-2, ##P < 0.01 vs. ch14.18/CHO.

Figure 5. Effect of PD-L1 on ch14.18/CHO-dependent cellular cytotoxicity (ADCC). To show the impact of PD-L1 on ADCC, a 2-step assay was used: first, LA-N-1 NB cells were cultured under ADCC conditions in the presence of subtherapeutic concentrations of ch14.18/CHO (10 ng/ml, 24 h) and effector cells (E:T 10:1) for induction of high level of PD-L1 on NB cells (black columns). After incubation, NB cells were harvested, labeled with calcein-AM as described in Materials and Methods and used for the second step: cytotoxicity assay with therapeutic ch14.18/CHO concentrations (10 µg/ml, 4 h) and effector cells (E:T 40:1). LA-N-1 expressing low level of PD-L1 (white columns) served as positive control and rituximab served as negative control. To show effects of PD-1- (gray column) and CD11b- (right black column) blockade, anti-PD-1 was added to leukocytes and anti-CD11b mAb was added to ADCC culture, respectively. The cytotoxicity assay (step 2) was performed after labeling of LA-N-1 cells with calcein-AM and performed in the absence of anti-CD11b Ab. Data are shown as mean values ± SEM of at least 3 independent experiments. ***P < 0.001 vs. rituximab, §§§P <0.001 vs. low expressing PD-L1 LA-N-1.
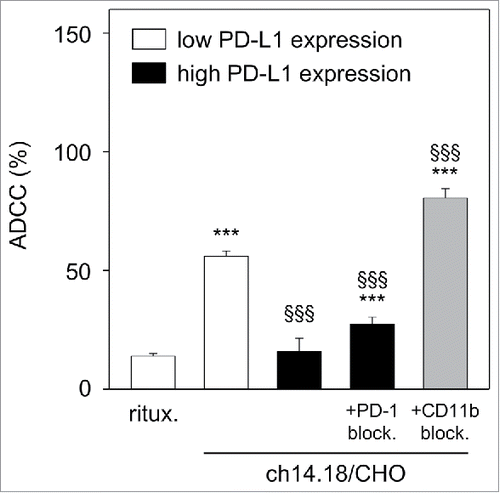
Figure 5. Effect of PD-L1 on ch14.18/CHO-dependent cellular cytotoxicity (ADCC). To show the impact of PD-L1 on ADCC, a 2-step assay was used: first, LA-N-1 NB cells were cultured under ADCC conditions in the presence of subtherapeutic concentrations of ch14.18/CHO (10 ng/ml, 24 h) and effector cells (E:T 10:1) for induction of high level of PD-L1 on NB cells (black columns). After incubation, NB cells were harvested, labeled with calcein-AM as described in Materials and Methods and used for the second step: cytotoxicity assay with therapeutic ch14.18/CHO concentrations (10 µg/ml, 4 h) and effector cells (E:T 40:1). LA-N-1 expressing low level of PD-L1 (white columns) served as positive control and rituximab served as negative control. To show effects of PD-1- (gray column) and CD11b- (right black column) blockade, anti-PD-1 was added to leukocytes and anti-CD11b mAb was added to ADCC culture, respectively. The cytotoxicity assay (step 2) was performed after labeling of LA-N-1 cells with calcein-AM and performed in the absence of anti-CD11b Ab. Data are shown as mean values ± SEM of at least 3 independent experiments. ***P < 0.001 vs. rituximab, §§§P <0.001 vs. low expressing PD-L1 LA-N-1.

Figure 6. Effect of CD11b-blockade on PD-L1 expression by NB cells LA-N-1 and 3 leukocytes populations (granulocytes, monocytes and lymphocytes). PD-L1 expression was induced by ADCC culture conditions (24 h incubation of LA-N-1 with subtherapeutic concentration of ch14.18/CHO (10 ng/ml) and leukocytes (E:T 10:1)) with or without addition of anti-CD11b Ab. PD-L1 expression was analyzed by flow cytometry with PE-labeled anti-human PD-L1 Ab. Alexa647-labeled anti-GD2 and PE/Cy7-labeled anti-CD45 mAb were used to distinguish between NB cells (PD-L1+/GD2+/CD45) and leukocytes (PD-L1+/GD2/CD45+) (A, C-D) Representative histograms of PD-L1 expression by NB cells LA-N-1 (A), granulocytes (C) and monocytes (D) (since ADCC did not affect PD-L1 expression by lymphocytes, the representative histogram for these effector cells is not shown). PD-L1 expression was determined under ADCC conditions in the presence (dashed black line) and absence of anti-CD11b Ab (solid black line) relative to untreated controls (filled gray line). PD-L1 expression level on NB cells LA-N-1 (B) and leukocytes (E) was determined using relative geometric mean fluorescence intensity (rgMFI) according to the formula: MFI of PD-L1 by treated cells - MFI of PD-L1 by the respective untreated control. Data are shown as mean values ± SEM of at least 3 independent experiments. t-test, **P < 0.01 vs. ADCC + anti-CD11b.
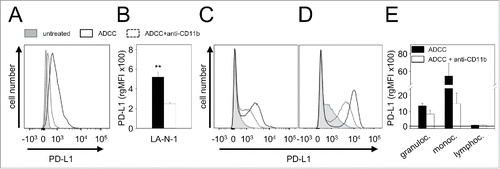
Figure 6. Effect of CD11b-blockade on PD-L1 expression by NB cells LA-N-1 and 3 leukocytes populations (granulocytes, monocytes and lymphocytes). PD-L1 expression was induced by ADCC culture conditions (24 h incubation of LA-N-1 with subtherapeutic concentration of ch14.18/CHO (10 ng/ml) and leukocytes (E:T 10:1)) with or without addition of anti-CD11b Ab. PD-L1 expression was analyzed by flow cytometry with PE-labeled anti-human PD-L1 Ab. Alexa647-labeled anti-GD2 and PE/Cy7-labeled anti-CD45 mAb were used to distinguish between NB cells (PD-L1+/GD2+/CD45−) and leukocytes (PD-L1+/GD2−/CD45+) (A, C-D) Representative histograms of PD-L1 expression by NB cells LA-N-1 (A), granulocytes (C) and monocytes (D) (since ADCC did not affect PD-L1 expression by lymphocytes, the representative histogram for these effector cells is not shown). PD-L1 expression was determined under ADCC conditions in the presence (dashed black line) and absence of anti-CD11b Ab (solid black line) relative to untreated controls (filled gray line). PD-L1 expression level on NB cells LA-N-1 (B) and leukocytes (E) was determined using relative geometric mean fluorescence intensity (rgMFI) according to the formula: MFI of PD-L1 by treated cells - MFI of PD-L1 by the respective untreated control. Data are shown as mean values ± SEM of at least 3 independent experiments. t-test, **P < 0.01 vs. ADCC + anti-CD11b.

Figure 7. Characterization of the murine NB cell line NXS2-HGW. (A-C) Representative immunohistochemical images of GD2 expression (left) and respective negative controls (right). NXS2-HGW cells cultivated onto chamber slides (A-B) and primary tumors obtained from A/J mice inoculated subcutaneously with NXS2-HGW cells (C) were analyzed for GD2-expression (magnification of 100x (A), 200x (B) and 400x (C)). (D) PD-L1 expression analysis by the parental NXS2 cells (left histogram) in comparison with NXS2-derived NXS2-HGW cells (right histogram) by flow cytometry. Cells were stained with PE-labeled anti-mouse PD-L1 Ab (filled black curve) relative to isotype control (open gray curve). Results are shown as representative histograms from at least 5 independent experiments. (E) RT-PCR analysis of MYCN- (product size: 248 bp), TH- (187 bp) and PD-L1 (180 bp) mRNA in NXS2-HGW cells. GAPDH (223 bp) served as internal control. NTC - no template control. (F) GD2 expression by the parental NXS2 cells in comparison with NXS2-derived NXS2-HGW cells (passage 49 for NXS2 and passage 1, 12 and 29 for NXS2-HGW) by flow cytometry. Cells were stained with chimeric ch14.18/CHO and PE-labeled anti-human IgG served as primary and secondary antibody, respectively (filled black curve). Rituximab served as isotype control (open gray curve). Results are shown as representative histograms from independent experiments.
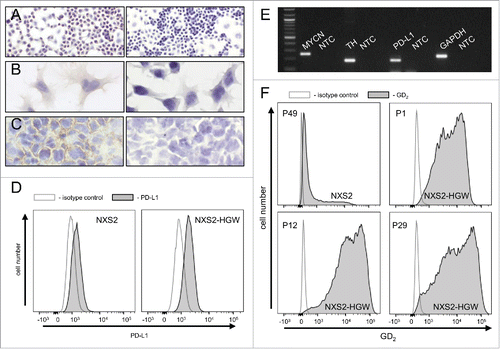
Figure 7. Characterization of the murine NB cell line NXS2-HGW. (A-C) Representative immunohistochemical images of GD2 expression (left) and respective negative controls (right). NXS2-HGW cells cultivated onto chamber slides (A-B) and primary tumors obtained from A/J mice inoculated subcutaneously with NXS2-HGW cells (C) were analyzed for GD2-expression (magnification of 100x (A), 200x (B) and 400x (C)). (D) PD-L1 expression analysis by the parental NXS2 cells (left histogram) in comparison with NXS2-derived NXS2-HGW cells (right histogram) by flow cytometry. Cells were stained with PE-labeled anti-mouse PD-L1 Ab (filled black curve) relative to isotype control (open gray curve). Results are shown as representative histograms from at least 5 independent experiments. (E) RT-PCR analysis of MYCN- (product size: 248 bp), TH- (187 bp) and PD-L1 (180 bp) mRNA in NXS2-HGW cells. GAPDH (223 bp) served as internal control. NTC - no template control. (F) GD2 expression by the parental NXS2 cells in comparison with NXS2-derived NXS2-HGW cells (passage 49 for NXS2 and passage 1, 12 and 29 for NXS2-HGW) by flow cytometry. Cells were stained with chimeric ch14.18/CHO and PE-labeled anti-human IgG served as primary and secondary antibody, respectively (filled black curve). Rituximab served as isotype control (open gray curve). Results are shown as representative histograms from independent experiments.

Figure 8. Anti-tumor effects of the combinatorial treatment with ch14.18/CHO and anti-PD-1 antibodies in vivo. (A) Schematic overview of the treatment schedule. The GD2- and PD-L1 expressing murine NB cells NXS2-HGW were injected subcutaneously into A/J mice followed by treatment with ch14.18/CHO in combination with PD-1 blockade. Four days after the last anti-PD-1 application blood samples were collected and mice were killed followed by isolation of splenocytes for evaluation of anti-tumor cytotoxicity. (B) Analysis of tumor growth (closed squares for combinatorial treatment; open squares and closed circles for treatment with ch14.18/CHO and anti-PD-1, respectively). Controls received 0.9% NaCl (open circles). In the case of appearance of having tumor burden, mice were killed ahead of schedule and the data of the last tumor volume measurement were included into subsequent calculation for the respective treatment group. Data are shown as mean values ± SEM. Kruskal-Wallis test: *P < 0.05 vs. ch14.18/CHO group, ***P < 0.001 vs. combined group. (C) Comparison of end point tumor volume was performed at the time point when mice were killed either ahead of schedule or at the end of the experiment (day 32). Mice were treated with ch14.18/CHO in combination with PD-1 blockade (black column), ch14.18/CHO (white column) or anti-PD-1 (white and striped column). Control mice received 0.9% NaCl (gray column). Data are shown as mean values ± SEM. Kruskal-Wallis test, differences between the groups were not significant. (D) Comparison of overall survival (left diagram) and event-free survival probabilities (right diagram) of mice treated with ch14.18/CHO in combination with PD-1 blockade (black solid line), ch14.18/CHO (gray solid line), anti-PD-1 (gray dashed line) or control mice (0.9% NaCl, black dashed line). For overall and event-free survival, death ahead of schedule and a tumor volume of 150 mm3 were defined as event, respectively. Statistical analysis was performed using LogRank test. For overall survival: *P < 0.05 vs. control group. For event-free survival: ***P < 0.001 and **P = 0.01 vs. control.
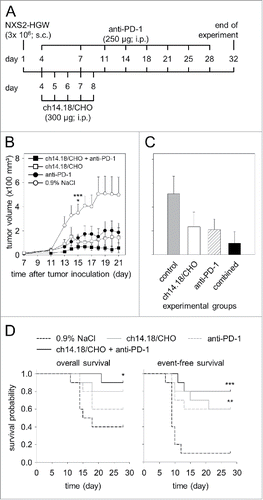
Figure 8. Anti-tumor effects of the combinatorial treatment with ch14.18/CHO and anti-PD-1 antibodies in vivo. (A) Schematic overview of the treatment schedule. The GD2- and PD-L1 expressing murine NB cells NXS2-HGW were injected subcutaneously into A/J mice followed by treatment with ch14.18/CHO in combination with PD-1 blockade. Four days after the last anti-PD-1 application blood samples were collected and mice were killed followed by isolation of splenocytes for evaluation of anti-tumor cytotoxicity. (B) Analysis of tumor growth (closed squares for combinatorial treatment; open squares and closed circles for treatment with ch14.18/CHO and anti-PD-1, respectively). Controls received 0.9% NaCl (open circles). In the case of appearance of having tumor burden, mice were killed ahead of schedule and the data of the last tumor volume measurement were included into subsequent calculation for the respective treatment group. Data are shown as mean values ± SEM. Kruskal-Wallis test: *P < 0.05 vs. ch14.18/CHO group, ***P < 0.001 vs. combined group. (C) Comparison of end point tumor volume was performed at the time point when mice were killed either ahead of schedule or at the end of the experiment (day 32). Mice were treated with ch14.18/CHO in combination with PD-1 blockade (black column), ch14.18/CHO (white column) or anti-PD-1 (white and striped column). Control mice received 0.9% NaCl (gray column). Data are shown as mean values ± SEM. Kruskal-Wallis test, differences between the groups were not significant. (D) Comparison of overall survival (left diagram) and event-free survival probabilities (right diagram) of mice treated with ch14.18/CHO in combination with PD-1 blockade (black solid line), ch14.18/CHO (gray solid line), anti-PD-1 (gray dashed line) or control mice (0.9% NaCl, black dashed line). For overall and event-free survival, death ahead of schedule and a tumor volume of 150 mm3 were defined as event, respectively. Statistical analysis was performed using LogRank test. For overall survival: *P < 0.05 vs. control group. For event-free survival: ***P < 0.001 and **P = 0.01 vs. control.

Figure 9. Anti-tumor effects of the combinatorial treatment with ch14.18/CHO and anti-PD-1 antibodies in vitro. Anti-tumor cytotoxicity mediated by effector cells (E:T ratio of 100:1) and serum (12.5% final concentration) of experimental mice was analyzed against murine GD2- and PD-L1-positive NB cells NXS2-HGW using calcein-AM-based cytotoxicity assay. Data are shown as mean values ± SEM of experiments performed at least in triplicate. Kruskal-Wallis test, differences between the groups were not significant.
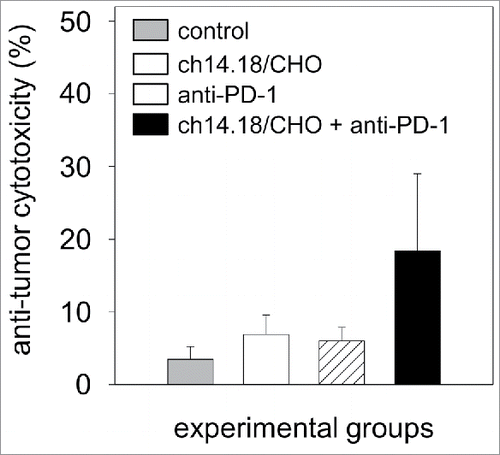
Figure 9. Anti-tumor effects of the combinatorial treatment with ch14.18/CHO and anti-PD-1 antibodies in vitro. Anti-tumor cytotoxicity mediated by effector cells (E:T ratio of 100:1) and serum (12.5% final concentration) of experimental mice was analyzed against murine GD2- and PD-L1-positive NB cells NXS2-HGW using calcein-AM-based cytotoxicity assay. Data are shown as mean values ± SEM of experiments performed at least in triplicate. Kruskal-Wallis test, differences between the groups were not significant.

Table 1. Primer sequences. Gene-specific primer sequences for murine MYCN (mMYCN), murine tyrosine hydroxylase (mTH), murine and human PD-L1 (mPD-L1 and hPD-L1, respectively). Murine and human GAPDH served as internal control, respectively.

Table 2. Serum level of ch14.18/CHO. Concentration of anti-GD2 antibody ch14.18/CHO in serum of treated mice was evaluated 24 d after the last Ab injection ELISA.

Reprints and Corporate Permissions

Please note: Selecting permissions does not provide access to the full text of the article, please see our help page How do I view content?

To request a reprint or corporate permissions for this article, please click on the relevant link below:

Academic Permissions

Please note: Selecting permissions does not provide access to the full text of the article, please see our help page How do I view content?

Obtain permissions instantly via Rightslink by clicking on the button below:

If you are unable to obtain permissions via Rightslink, please complete and submit this Permissions form. For more information, please visit our Permissions help page.