1,239
Views
11
CrossRef citations to date
0
Altmetric
Original Research

Ig-like transcript 2 (ILT2) suppresses T cell function in chronic lymphocytic leukemia

ORCID Icon, ORCID Icon, , , , , & ORCID Icon show all
Article: e1353856 | Received 30 Jan 2017, Accepted 28 Jun 2017, Published online: 22 Aug 2017

Figures & data

Table 1. Clinical characteristics of CLL patients.

Figure 1. ILT2 expression is reduced on the surface of leukemic cells. (A) PBMCs from 52 CLL patients and 20 healthy donors were stained with CD19-, CD5- and ILT2-conjugated antibodies and analyzed by flow cytometry. The histogram shows the ILT2 expression in B cells from a healthy donor and leukemic cells (CD19+CD5+) from a patient. (B) The comparison between the MFI ± SEM of ILT2 surface expression on B cells from controls and patients is shown. (C) The comparison between percentage ± SEM of ILT2+ B cells from controls and patients is shown. Horizontal bars represent the mean.
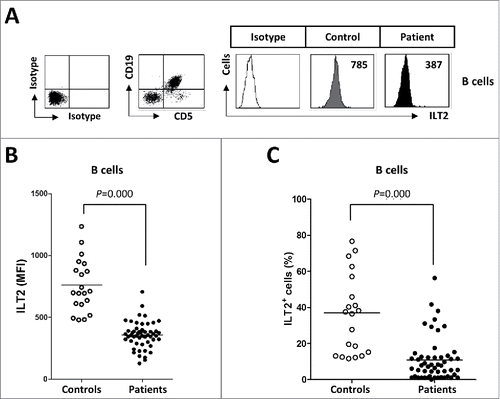
Figure 1. ILT2 expression is reduced on the surface of leukemic cells. (A) PBMCs from 52 CLL patients and 20 healthy donors were stained with CD19-, CD5- and ILT2-conjugated antibodies and analyzed by flow cytometry. The histogram shows the ILT2 expression in B cells from a healthy donor and leukemic cells (CD19+CD5+) from a patient. (B) The comparison between the MFI ± SEM of ILT2 surface expression on B cells from controls and patients is shown. (C) The comparison between percentage ± SEM of ILT2+ B cells from controls and patients is shown. Horizontal bars represent the mean.

Figure 2. ILT2 is overexpressed on T cells from CLL patients. (A) PBMCs were obtained from 52 CLL patients and 20 healthy donors and the expression of ILT2 on T cells, and CD8 and CD4 T cell subsets was determined by staining the cells with CD3-, CD4-, CD8-, and ILT2-conjugated antibodies. Dot plots show the cytometric prolife of a CLL patient. Histograms in the right show flow cytometry profiles of a healthy donor and a representative patient. The comparison of the MFI of ILT2 surface expression on T cells (B), CD8 T cells (C) and CD4 T cells (D) between controls and patients is shown.
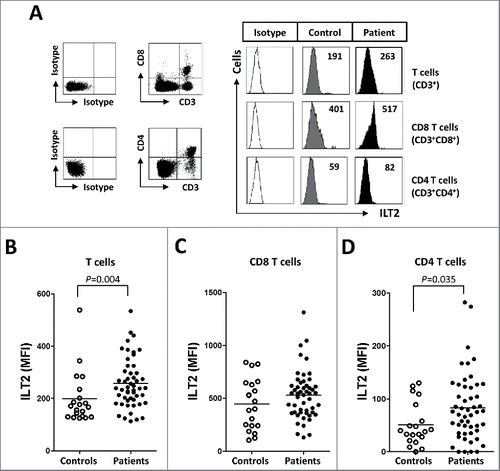
Figure 2. ILT2 is overexpressed on T cells from CLL patients. (A) PBMCs were obtained from 52 CLL patients and 20 healthy donors and the expression of ILT2 on T cells, and CD8 and CD4 T cell subsets was determined by staining the cells with CD3-, CD4-, CD8-, and ILT2-conjugated antibodies. Dot plots show the cytometric prolife of a CLL patient. Histograms in the right show flow cytometry profiles of a healthy donor and a representative patient. The comparison of the MFI of ILT2 surface expression on T cells (B), CD8 T cells (C) and CD4 T cells (D) between controls and patients is shown.

Figure 3. ILT2 expression correlates with cytogenetic abnormalities that are markers of the progression of the disease. (A) Comparison between ILT2+ CD8 T cells, ILT2+ CD4 T cells, and ILT2+ B cells from CLL patients stratified by the presence of chromosome 11q deletion. Horizontal bars represent the mean ± SEM. (B) The comparison between ILT2+ CD4 T cells, ILT2+ CD8 T cells and ILT2+ B cells from CLL patients with or without chromosome 13q deletion is shown.
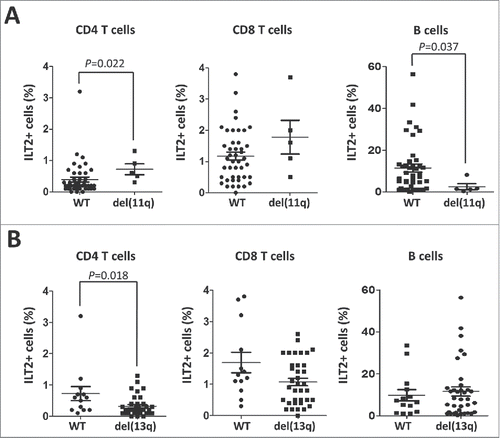
Figure 3. ILT2 expression correlates with cytogenetic abnormalities that are markers of the progression of the disease. (A) Comparison between ILT2+ CD8 T cells, ILT2+ CD4 T cells, and ILT2+ B cells from CLL patients stratified by the presence of chromosome 11q deletion. Horizontal bars represent the mean ± SEM. (B) The comparison between ILT2+ CD4 T cells, ILT2+ CD8 T cells and ILT2+ B cells from CLL patients with or without chromosome 13q deletion is shown.

Figure 4. The expression of ILT2 ligands is dysregulated in leukemic cells from CLL patients. The figure shows the comparison of the MFI of HLA-G (A), HLA-E (B), HLA-F (C) and MHC class I (MHC-I) (D) expression between B cells from patients and controls analyzed by flow cytometry.
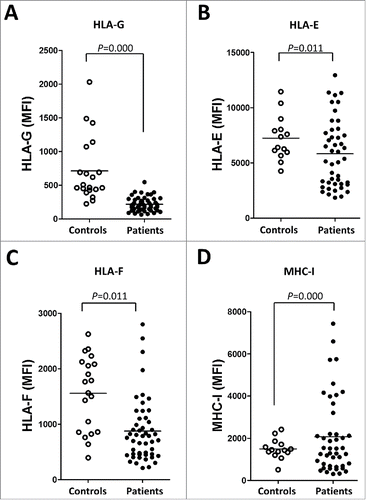
Figure 4. The expression of ILT2 ligands is dysregulated in leukemic cells from CLL patients. The figure shows the comparison of the MFI of HLA-G (A), HLA-E (B), HLA-F (C) and MHC class I (MHC-I) (D) expression between B cells from patients and controls analyzed by flow cytometry.

Figure 5. ILT2 blockade promotes T-cell activation. Flow cytometry analyses were conducted to evaluate the expression of CD69 in PBMCs from 14 CLL patients stimulated with IL-2 (50 U/mL) or PHA (5 µg/mL) and incubated in the presence of anti-ILT2 blocking antibody or irrelevant IgG1 (10 μg/mL) for 48 hours. The figure shows the comparison between the surface expression of CD69 detected on T cells (A), CD8 T cells (B), CD4 T cells (C) and leukemic cells (D) from CLL patients. Bars represent the mean MFI of CD69 ± SEM for each condition.
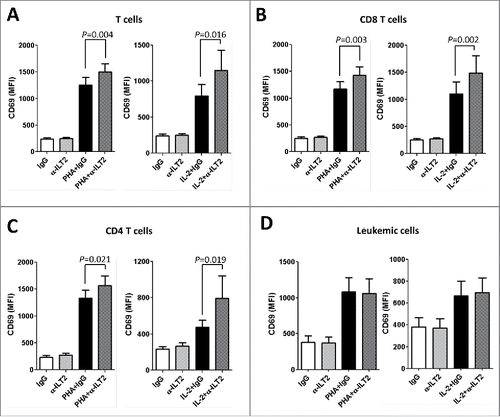
Figure 5. ILT2 blockade promotes T-cell activation. Flow cytometry analyses were conducted to evaluate the expression of CD69 in PBMCs from 14 CLL patients stimulated with IL-2 (50 U/mL) or PHA (5 µg/mL) and incubated in the presence of anti-ILT2 blocking antibody or irrelevant IgG1 (10 μg/mL) for 48 hours. The figure shows the comparison between the surface expression of CD69 detected on T cells (A), CD8 T cells (B), CD4 T cells (C) and leukemic cells (D) from CLL patients. Bars represent the mean MFI of CD69 ± SEM for each condition.

Figure 6. ILT2 inhibits T cell proliferation in CLL and healthy donors. (A) IL-2-stimulated (50 U/mL) or unstimulated PBMCs obtained from 12 CLL patients and 7 healthy donors were stained with CFSE and cultured in the presence of anti-ILT2 blocking antibody (10 μg/ml) or irrelevant IgG1 for 7 days, and the proliferation of different cell subsets was analyzed by flow cytometry. Histograms show the flow cytometry profiles corresponding to CFSE expression in T cells, CD8 T cells, CD4 T cells and leukemic cells of a representative CLL patient. (B-E) Comparison of the percentage of proliferating T cells (B), CD8 T cells (C), CD4 T cells (D) and B cells (E) from patients and donors between the different experimental conditions analyzed are shown. Bars represent the mean ± SEM from samples analyzed.
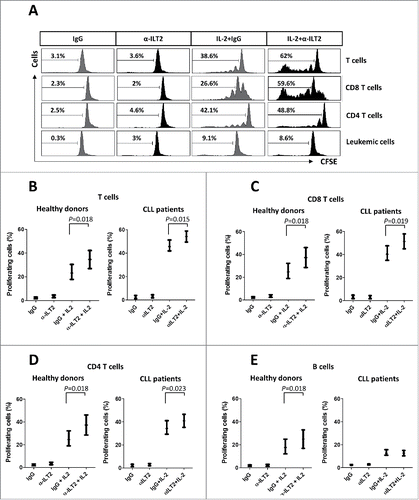
Figure 6. ILT2 inhibits T cell proliferation in CLL and healthy donors. (A) IL-2-stimulated (50 U/mL) or unstimulated PBMCs obtained from 12 CLL patients and 7 healthy donors were stained with CFSE and cultured in the presence of anti-ILT2 blocking antibody (10 μg/ml) or irrelevant IgG1 for 7 days, and the proliferation of different cell subsets was analyzed by flow cytometry. Histograms show the flow cytometry profiles corresponding to CFSE expression in T cells, CD8 T cells, CD4 T cells and leukemic cells of a representative CLL patient. (B-E) Comparison of the percentage of proliferating T cells (B), CD8 T cells (C), CD4 T cells (D) and B cells (E) from patients and donors between the different experimental conditions analyzed are shown. Bars represent the mean ± SEM from samples analyzed.
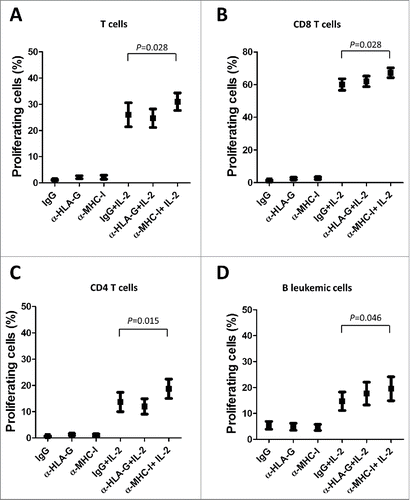
Figure 7. MHC class I molecules inhibits T and B cell proliferation in CLL. IL-2-stimulated or unstimulated PBMCs obtained from 6 CLL patients were stained with CFSE and cultured in the presence of anti-HLA-G blocking antibody, anti-MHC-I blocking antibody (both 10 μg/ml) or irrelevant IgG for 7 days, and the proliferation of different cell subsets was analyzed by flow cytometry. The comparison of the percentage of proliferating T cells (A), CD8 T cells (B), CD4 T cells (C) and B cells (D) between the different experimental conditions analyzed are shown. Bars represent the mean ± SEM from samples analyzed.

Figure 7. MHC class I molecules inhibits T and B cell proliferation in CLL. IL-2-stimulated or unstimulated PBMCs obtained from 6 CLL patients were stained with CFSE and cultured in the presence of anti-HLA-G blocking antibody, anti-MHC-I blocking antibody (both 10 μg/ml) or irrelevant IgG for 7 days, and the proliferation of different cell subsets was analyzed by flow cytometry. The comparison of the percentage of proliferating T cells (A), CD8 T cells (B), CD4 T cells (C) and B cells (D) between the different experimental conditions analyzed are shown. Bars represent the mean ± SEM from samples analyzed.

Figure 8. ILT2 blockade increases IL-2 levels and reduces IFN-γ production by T cells in CLL patients. (A) PBMCs from 15 CLL patients and 6 donors were cultured in the presence of anti-ILT2 blocking antibody or irrelevant IgG1 for 48 hours, and the intracytoplasmic expression of IL-2 and IFN-γ was analyzed in T and B cells by flow cytometry. Dot plots show the level of IL-2 expression in CD4 T cells and IFN-γ expression in CD8 T cells from a CLL patient. The mean of percentage ± SEM of intracytoplasmic levels of IL-2 in patients (B) and healthy donors (C) is shown. The intracytoplasmic expression of IFN-γ in patients (D) and healthy donors (E) is shown.
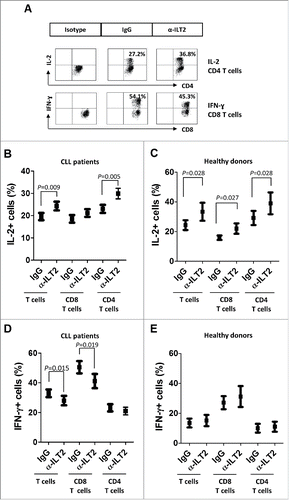
Figure 8. ILT2 blockade increases IL-2 levels and reduces IFN-γ production by T cells in CLL patients. (A) PBMCs from 15 CLL patients and 6 donors were cultured in the presence of anti-ILT2 blocking antibody or irrelevant IgG1 for 48 hours, and the intracytoplasmic expression of IL-2 and IFN-γ was analyzed in T and B cells by flow cytometry. Dot plots show the level of IL-2 expression in CD4 T cells and IFN-γ expression in CD8 T cells from a CLL patient. The mean of percentage ± SEM of intracytoplasmic levels of IL-2 in patients (B) and healthy donors (C) is shown. The intracytoplasmic expression of IFN-γ in patients (D) and healthy donors (E) is shown.
Supplemental material

KONI_A_1353856_Supplementary_materials.pdf

Download PDF (491 KB)

Reprints and Corporate Permissions

Please note: Selecting permissions does not provide access to the full text of the article, please see our help page How do I view content?

To request a reprint or corporate permissions for this article, please click on the relevant link below:

Academic Permissions

Please note: Selecting permissions does not provide access to the full text of the article, please see our help page How do I view content?

Obtain permissions instantly via Rightslink by clicking on the button below:

If you are unable to obtain permissions via Rightslink, please complete and submit this Permissions form. For more information, please visit our Permissions help page.