5,157
Views
54
CrossRef citations to date
0
Altmetric
Original Research

A bispecific nanobody approach to leverage the potent and widely applicable tumor cytolytic capacity of Vγ9Vδ2-T cells

, , , , , , , , , , , ORCID Icon, ORCID Icon, ORCID Icon, , & show all
Article: e1375641 | Received 03 May 2017, Accepted 31 Aug 2017, Published online: 20 Oct 2017

Figures & data

Figure 1. Characteristics of Vγ9Vδ2-T cell activating VHH. (A-C) Vγ9Vδ2-T cells were cultured with individual plate bound (wells coated with 500 nM) anti-Vγ9Vδ2-TCR VHH, control VHH R2, HeLa cells or NBP-pretreated HeLa cells in a 1:1 ratio. After 24 hrs, Vγ9Vδ2-T cell activation was determined by assessing the percentage of Vγ9Vδ2-T cells positive for (A) CD25, (B) CD107a, or (C) intracellular IFN-γ using flow cytometry. Shown are means substracted by background levels ± SEM of n = 3-5 experiments. p-Values were calculated with a one-way ANOVA and Bonferroni's post-hoc test. (* indicates p<0.05 and ** indicates p<0.01). (D) The anti-Vδ2 VHH 6H4 (40 nM) binds to Jurkat-Vγ9Vδ2-TCR cells (thick line), but not to Jurkat cells without TCR expression (filled grey) or Jurkat-Vα24Vβ11-TCR cells (dotted line). (E) The anti-Vδ2 VHH 6H4 (350 nM) binds to healthy donor-derived Vγ9+Vδ2+ (thick line) and Vγ9Vδ2+ γδ-T cells but not to Vγ9Vδ2 (filled grey) or Vγ9+Vδ2 γδ-T cells (dotted line). (F) Vγ9Vδ2-T cells were cultured with plate bound or soluble monovalent VHH (filled squares), bivalent VHH (filled triangles) or control VHH R2 (open circles) at the indicated concentrations for 24 hrs. Expression of CD25 was assessed using flow cytometry. Representative figures of n = 3 experiments are shown. Abbreviations: aminobisphosphonates (NBP); Gly4Ser (GS).
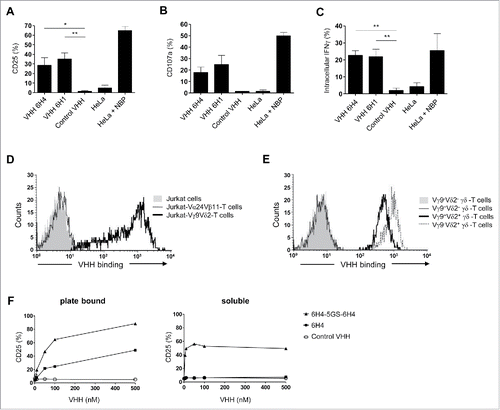
Figure 1. Characteristics of Vγ9Vδ2-T cell activating VHH. (A-C) Vγ9Vδ2-T cells were cultured with individual plate bound (wells coated with 500 nM) anti-Vγ9Vδ2-TCR VHH, control VHH R2, HeLa cells or NBP-pretreated HeLa cells in a 1:1 ratio. After 24 hrs, Vγ9Vδ2-T cell activation was determined by assessing the percentage of Vγ9Vδ2-T cells positive for (A) CD25, (B) CD107a, or (C) intracellular IFN-γ using flow cytometry. Shown are means substracted by background levels ± SEM of n = 3-5 experiments. p-Values were calculated with a one-way ANOVA and Bonferroni's post-hoc test. (* indicates p<0.05 and ** indicates p<0.01). (D) The anti-Vδ2 VHH 6H4 (40 nM) binds to Jurkat-Vγ9Vδ2-TCR cells (thick line), but not to Jurkat cells without TCR expression (filled grey) or Jurkat-Vα24Vβ11-TCR cells (dotted line). (E) The anti-Vδ2 VHH 6H4 (350 nM) binds to healthy donor-derived Vγ9+Vδ2+ (thick line) and Vγ9−Vδ2+ γδ-T cells but not to Vγ9−Vδ2− (filled grey) or Vγ9+Vδ2− γδ-T cells (dotted line). (F) Vγ9Vδ2-T cells were cultured with plate bound or soluble monovalent VHH (filled squares), bivalent VHH (filled triangles) or control VHH R2 (open circles) at the indicated concentrations for 24 hrs. Expression of CD25 was assessed using flow cytometry. Representative figures of n = 3 experiments are shown. Abbreviations: aminobisphosphonates (NBP); Gly4Ser (GS).

Figure 2. The effect of orientation and linker length in the bispecific VHH. (A and B) Vγ9Vδ2-T cells (left) or EGFR-expressing A431 cells (right) were incubated in the presence or absence of the indicated VHHs and bound VHH was assessed by flow cytometry. Mean fluorescence intensity (MF) of bound VHH to the cells is depicted. (C) Vγ9Vδ2-T cells and A431 cells were co-cultured in a 1:1 ratio for 24 hrs in the presence or absence of the indicated bispecific VHH. Both CD25 (left) and CD107a (middle) expression on Vγ9Vδ2-T cells were assessed by flow cytometry. The percentage of lysed A431 cells (right) was determined using 7-AAD staining and flow cytometry. Representative figures of n = 3 experiments are shown. Abbreviations: Gly4Ser (GS).
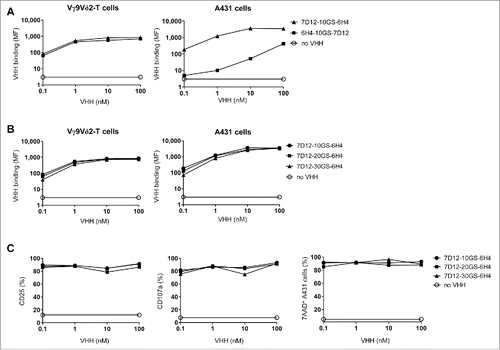
Figure 2. The effect of orientation and linker length in the bispecific VHH. (A and B) Vγ9Vδ2-T cells (left) or EGFR-expressing A431 cells (right) were incubated in the presence or absence of the indicated VHHs and bound VHH was assessed by flow cytometry. Mean fluorescence intensity (MF) of bound VHH to the cells is depicted. (C) Vγ9Vδ2-T cells and A431 cells were co-cultured in a 1:1 ratio for 24 hrs in the presence or absence of the indicated bispecific VHH. Both CD25 (left) and CD107a (middle) expression on Vγ9Vδ2-T cells were assessed by flow cytometry. The percentage of lysed A431 cells (right) was determined using 7-AAD staining and flow cytometry. Representative figures of n = 3 experiments are shown. Abbreviations: Gly4Ser (GS).

Figure 3. The 7D12-5GS-6H4 bispecific VHH induces Vγ9Vδ2-T cell activation and lysis of EGFR expressing tumor cells. Vγ9Vδ2-T cells were cultured with or without EGFR+ A431 tumor cells (A-B) or EGFR JY cells (B) in a 1:1 ratio in the presence of the 7D12-5GS-6H4 bispecific VHH or a bispecific control VHH. VHH concentrations: (A) 10 nM; (B) as indicated. For control situations, Vγ9Vδ2-T cells were co-cultured with target cells in the absence of VHH (no VHH; negative control) or with NBP-pretreated target cells (positive control). After 24 hrs, Vγ9Vδ2-T cell activation and degranulation was determined by assessing the percentage of CD25 or CD107a expression, respectively by flow cytometry. The percentage of lysed target cells was determined using 7-AAD staining and flow cytometry. A) White bars represent Vγ9Vδ2-T cell mono-cultures in the absence of VHH, grey bars represent target cell mono-cultures in the absence of VHH and black bars represent Vγ9Vδ2-T cell co-cultures with target cells and indicated VHH. B) Co-cultures of target cells with Vγ9Vδ2-T cells and indicated amount of 7D12-5GS-6H4 bispecific VHH. Shown are mean ± SEM of n = 3-4 experiments. p-Values were calculated with a one-way ANOVA and Bonferroni's post-hoc test (* indicates p<0.05 and *** indicates p<0.001). Abbreviations: aminobisphosphonates (NBP); Gly4Ser (GS).
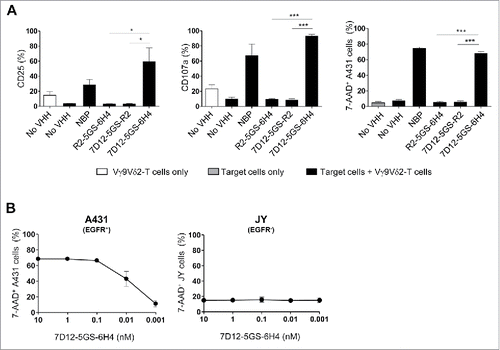
Figure 3. The 7D12-5GS-6H4 bispecific VHH induces Vγ9Vδ2-T cell activation and lysis of EGFR expressing tumor cells. Vγ9Vδ2-T cells were cultured with or without EGFR+ A431 tumor cells (A-B) or EGFR− JY cells (B) in a 1:1 ratio in the presence of the 7D12-5GS-6H4 bispecific VHH or a bispecific control VHH. VHH concentrations: (A) 10 nM; (B) as indicated. For control situations, Vγ9Vδ2-T cells were co-cultured with target cells in the absence of VHH (no VHH; negative control) or with NBP-pretreated target cells (positive control). After 24 hrs, Vγ9Vδ2-T cell activation and degranulation was determined by assessing the percentage of CD25 or CD107a expression, respectively by flow cytometry. The percentage of lysed target cells was determined using 7-AAD staining and flow cytometry. A) White bars represent Vγ9Vδ2-T cell mono-cultures in the absence of VHH, grey bars represent target cell mono-cultures in the absence of VHH and black bars represent Vγ9Vδ2-T cell co-cultures with target cells and indicated VHH. B) Co-cultures of target cells with Vγ9Vδ2-T cells and indicated amount of 7D12-5GS-6H4 bispecific VHH. Shown are mean ± SEM of n = 3-4 experiments. p-Values were calculated with a one-way ANOVA and Bonferroni's post-hoc test (* indicates p<0.05 and *** indicates p<0.001). Abbreviations: aminobisphosphonates (NBP); Gly4Ser (GS).

Figure 4. The 7D12-5GS-6H4 bispecific VHH inhibits EGFR signaling but does not depend on this to induce tumor cell lysis. (A) The anti-EGFR 7D12 VHH retains its capacity to inhibit phosphorylation of EGFR when incorporated in a bispecific 7D12-5GS-6H4 VHH format. Her14 cells were incubated with a mixture of 8 nM human EGF and the indicated VHH. Cell lysates were run on SDS-PAGE gel and western blotted for phosphorylated EGFRTyr1068 and β-actin as a loading control. (B-I) Vγ9Vδ2-T cells were cultured with or without the EGFR+ colon tumor cells SW480 KRASG12V (B-E) or HT29 BRAFV600E (F-I) for 24 hours or primary colon cancer cells for 4 hours (J) in a 1:1 ratio in the presence of the 7D12-5GS-6H4 bispecific VHH or a bispecific control VHH. VHH concentrations: B-D, F-H and J) 10 nM; E and I) as indicated. For control conditions, Vγ9Vδ2-T cells were co-cultured with target cells in the absence of VHH (no VHH; negative control) or with NBP-pretreated target cells (positive control). Vγ9Vδ2-T cell activation and degranulation was determined by assessing the percentage of CD25 (B) and (F) or CD107a (C and G) expression, respectively by flow cytometry. The percentage of lysed target cells was determined using 7-AAD staining and flow cytometry (D-E and H-J). B-D and (F-H) White bars represent Vγ9Vδ2-T cell mono-cultures in the absence of VHH, grey bars represent target cell mono-cultures in the absence of VHH and black bars represent Vγ9Vδ2-T cell co-cultures with target cells and indicated VHH. E and (I) Co-cultures of target cells with Vγ9Vδ2-T cells and the indicated amount of 7D12-5GS-6H4 bispecific VHH. J) Lysis of patient derived primary colon cancer cells; tumor 1: mutation in KRAS exon 2, c.38G>A, p.G13D; tumor 2: mutation in BRAF exon 15, c.1799 T>A, p.V600E; tumor 3: RAS and BRAF wild-type. (K) All three colon cancer samples expressed EGFR as determined by flow cytometry. Shown are means ± SEM of n = 3 experiments. p-Values were calculated with a one-way ANOVA and Bonferroni's post-hoc test (* indicates p<0.05, ** indicates p<0.01 and *** indicates p<0.001). Abbreviations: aminobisphosphonate (NBP); Gly4Ser (GS); mean fluorescence index (MFI).
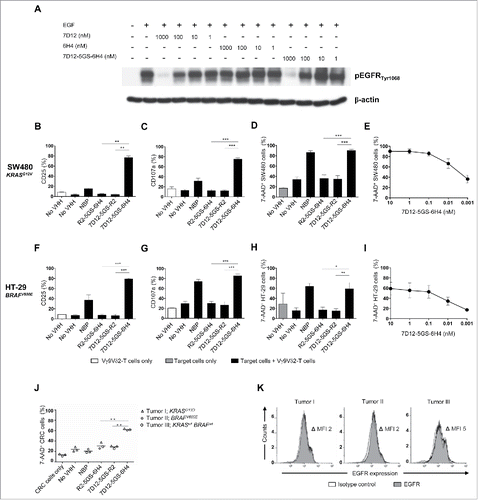
Figure 4. The 7D12-5GS-6H4 bispecific VHH inhibits EGFR signaling but does not depend on this to induce tumor cell lysis. (A) The anti-EGFR 7D12 VHH retains its capacity to inhibit phosphorylation of EGFR when incorporated in a bispecific 7D12-5GS-6H4 VHH format. Her14 cells were incubated with a mixture of 8 nM human EGF and the indicated VHH. Cell lysates were run on SDS-PAGE gel and western blotted for phosphorylated EGFRTyr1068 and β-actin as a loading control. (B-I) Vγ9Vδ2-T cells were cultured with or without the EGFR+ colon tumor cells SW480 KRASG12V (B-E) or HT29 BRAFV600E (F-I) for 24 hours or primary colon cancer cells for 4 hours (J) in a 1:1 ratio in the presence of the 7D12-5GS-6H4 bispecific VHH or a bispecific control VHH. VHH concentrations: B-D, F-H and J) 10 nM; E and I) as indicated. For control conditions, Vγ9Vδ2-T cells were co-cultured with target cells in the absence of VHH (no VHH; negative control) or with NBP-pretreated target cells (positive control). Vγ9Vδ2-T cell activation and degranulation was determined by assessing the percentage of CD25 (B) and (F) or CD107a (C and G) expression, respectively by flow cytometry. The percentage of lysed target cells was determined using 7-AAD staining and flow cytometry (D-E and H-J). B-D and (F-H) White bars represent Vγ9Vδ2-T cell mono-cultures in the absence of VHH, grey bars represent target cell mono-cultures in the absence of VHH and black bars represent Vγ9Vδ2-T cell co-cultures with target cells and indicated VHH. E and (I) Co-cultures of target cells with Vγ9Vδ2-T cells and the indicated amount of 7D12-5GS-6H4 bispecific VHH. J) Lysis of patient derived primary colon cancer cells; tumor 1: mutation in KRAS exon 2, c.38G>A, p.G13D; tumor 2: mutation in BRAF exon 15, c.1799 T>A, p.V600E; tumor 3: RAS and BRAF wild-type. (K) All three colon cancer samples expressed EGFR as determined by flow cytometry. Shown are means ± SEM of n = 3 experiments. p-Values were calculated with a one-way ANOVA and Bonferroni's post-hoc test (* indicates p<0.05, ** indicates p<0.01 and *** indicates p<0.001). Abbreviations: aminobisphosphonate (NBP); Gly4Ser (GS); mean fluorescence index (MFI).

Figure 5. The anti-Vγ9Vδ2-TCR specific VHH 6H4 efficiently activates Vγ9Vδ2-T cells harbouring δ2-CDR variations. (A) Indicated JurMa transductants were incubated with 500 nM VHH 6H4 and bound VHH was assessed by flow cytometry. Mean fluorescence intensity (MF) of VHH bound to the cells is depicted. A representative figure of n = 3 experiments is shown. (B) Indicated JurMa transductants were cultured with HeLa cells (negative control, white), NBP-pretreated HeLa cells (positive control, grey) or plate bound (wells coated with 500 nM) VHH 6H4 (black). After 24 hrs, the activation status of the cells was determined by assessing CD69 expression on the cells by flow cytometry. Indicated significant differences are relative to values of δ2-G115WT cells stimulated with HeLa cells. A representative figure of triplicate samples (mean ± SEM) of n = 3 experiments is shown. p-Values were calculated with a one-way ANOVA and Bonferroni's post-hoc test (*** indicates p<0.001). Abbreviations: aminobisphosphonates (NBP).
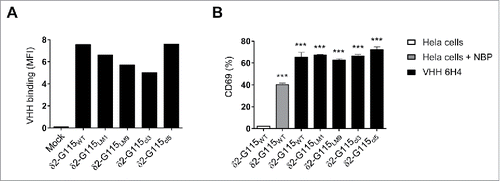
Figure 5. The anti-Vγ9Vδ2-TCR specific VHH 6H4 efficiently activates Vγ9Vδ2-T cells harbouring δ2-CDR variations. (A) Indicated JurMa transductants were incubated with 500 nM VHH 6H4 and bound VHH was assessed by flow cytometry. Mean fluorescence intensity (MF) of VHH bound to the cells is depicted. A representative figure of n = 3 experiments is shown. (B) Indicated JurMa transductants were cultured with HeLa cells (negative control, white), NBP-pretreated HeLa cells (positive control, grey) or plate bound (wells coated with 500 nM) VHH 6H4 (black). After 24 hrs, the activation status of the cells was determined by assessing CD69 expression on the cells by flow cytometry. Indicated significant differences are relative to values of δ2-G115WT cells stimulated with HeLa cells. A representative figure of triplicate samples (mean ± SEM) of n = 3 experiments is shown. p-Values were calculated with a one-way ANOVA and Bonferroni's post-hoc test (*** indicates p<0.001). Abbreviations: aminobisphosphonates (NBP).

Figure 6. The 7D12-5GS-6H4 bispecific VHH inhibits tumor growth in vivo. Immunodeficient BRGS mice grafted with SW480Gluc cells were treated with PBS (control group; (A), cetuximab (500 µg i.p.; group (B), Vγ9Vδ2-T cells (1*107 i.v.; group (C) or Vγ9Vδ2-T cells and 7D12-5GS-6H4 VHH (1*107and 1 µg, respectively, both i.v.; group (D) at days 1, 4 and 7. IL-2 (10,000 U, i.p.) was administered on days 1, 4, 7, 10, and 14 to the groups receiving Vγ9Vδ2-T cells. A) A schematic overview of the treatment schedule. B and C) Bioluminescence imaging at day 35 of 4 mice per treatment group. B) Heat map indicating the sites and relative level of tumor cell activity in individual mice. Red squares indicate the image field used for quantification analysis. C) Quantified bioluminescence signal measured per mouse expressed as the measured radiance normalized to the number of pixels, time and angle of imaging. Shown are means ± SEM of n = 4 mice per group. p-Values were calculated with a unpaired T-test (* indicates p<0.05). D) Kaplan-Meier analyses of mouse survival, n = 6 mice per group. p-Values were calculated with a Mantel-Cox test (* indicates p<0.05, ** indicates p<0.01 and *** indicates p<0.001). Abbreviations: Gly4Ser (GS).
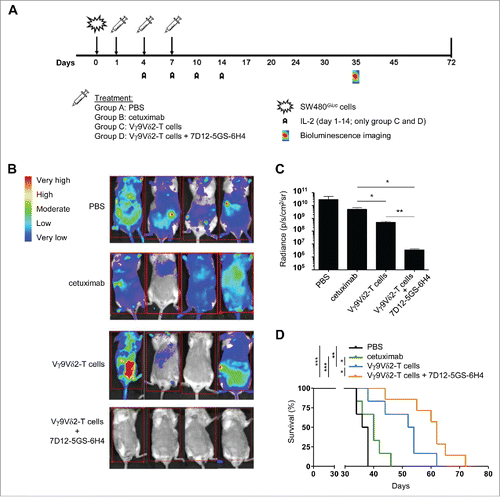
Figure 6. The 7D12-5GS-6H4 bispecific VHH inhibits tumor growth in vivo. Immunodeficient BRGS mice grafted with SW480Gluc cells were treated with PBS (control group; (A), cetuximab (500 µg i.p.; group (B), Vγ9Vδ2-T cells (1*107 i.v.; group (C) or Vγ9Vδ2-T cells and 7D12-5GS-6H4 VHH (1*107and 1 µg, respectively, both i.v.; group (D) at days 1, 4 and 7. IL-2 (10,000 U, i.p.) was administered on days 1, 4, 7, 10, and 14 to the groups receiving Vγ9Vδ2-T cells. A) A schematic overview of the treatment schedule. B and C) Bioluminescence imaging at day 35 of 4 mice per treatment group. B) Heat map indicating the sites and relative level of tumor cell activity in individual mice. Red squares indicate the image field used for quantification analysis. C) Quantified bioluminescence signal measured per mouse expressed as the measured radiance normalized to the number of pixels, time and angle of imaging. Shown are means ± SEM of n = 4 mice per group. p-Values were calculated with a unpaired T-test (* indicates p<0.05). D) Kaplan-Meier analyses of mouse survival, n = 6 mice per group. p-Values were calculated with a Mantel-Cox test (* indicates p<0.05, ** indicates p<0.01 and *** indicates p<0.001). Abbreviations: Gly4Ser (GS).
Supplemental material

2017ONCOIMM0338R-f07-z-bw.docx

Download MS Word (177.3 KB)

Reprints and Corporate Permissions

Please note: Selecting permissions does not provide access to the full text of the article, please see our help page How do I view content?

To request a reprint or corporate permissions for this article, please click on the relevant link below:

Academic Permissions

Please note: Selecting permissions does not provide access to the full text of the article, please see our help page How do I view content?

Obtain permissions instantly via Rightslink by clicking on the button below:

If you are unable to obtain permissions via Rightslink, please complete and submit this Permissions form. For more information, please visit our Permissions help page.