Figures & data
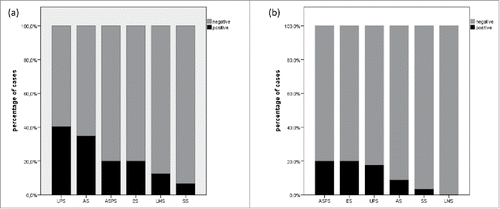
Table 1. PD-L1 expression in tumor cells and tumor-infiltrating lymphocytes and CD274/PD-L1 copy number status in high-grade sarcomas of soft-tissue; Mean and median value of cases with PD-L1 positive TCs respectively TILs are shown. TC Tumor cell; TIL Tumor-infiltrating lymphocyte; UPS Undifferentiated pleomorphic sarcoma; ASPS Alveolar soft part sarcoma; ES Epithelioid sarcoma AS Angiosarcoma; LMS Leiomyosarcoma; SS Synovial sarcoma.
Figure 1. Distribution of PD-L1 expression in tumor cells (a) and tumor-infiltrating lymphocytes (b) in high-grade sarcomas of soft tissue depending on histopathologic entity.

Table 2. Clinicopathological characteristics of patients with therapy-naïve undifferentiated pleomorphic sarcoma (UPS) of soft tissue (n=57).
Table 3. Distribution of immunological parameters among primary primary, therapy-naïve undifferentiated pleomorphic sarcomas (UPS) of soft tissue. TC Tumor cell; TIL Tumor infiltrating lymphocyte.
Table 4. Correlation of variables among each other. TC Tumor cell; TIL Tumor infiltrating lymphocyte.
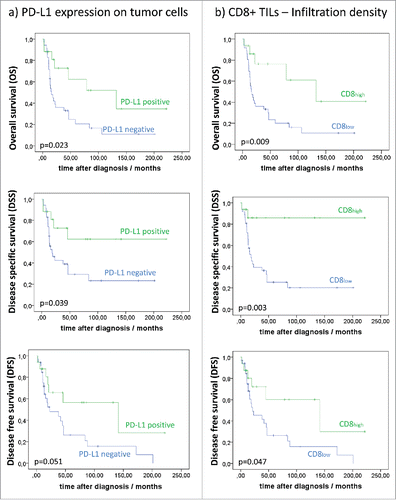
Figure 2. Association of infiltration density of (a) PD-L1 expression on tumor cells (TCs) and (b) CD8+ TILs with overall survival (OS), disease-specific survival (DSS) and disease-free survival (DFS).

Table 5. Survival associations for immunologic variables in undifferentiated pleomorphic sarcomas (UPS).
Table 6. Multivariate analysis including (a) PD-L1 expression on tumor cells, (b) CD8+ lymphocytic infiltrate, (c) CD3+ lymphocytic infiltrate. HR Hazard Ratio; CI Confidence Interval ; OS Overall Survival ; DSS Disease-specific Survival ; DFS Disease-free Survival.
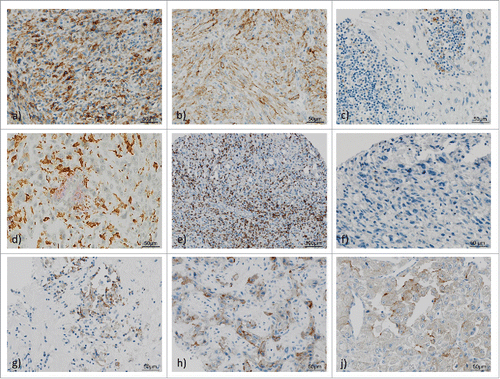
Figure 3. PD-L1, PD-1, CD3 and CD8 expression in high-grade sarcoma of soft tissue and tumor-infiltrating lymphocytes (TILs). 1 a)–1f) Representative examples of undifferentiated pleomorphic sarcoma (UPS) showing membraneous PD-L1 expression in tumor cells with (a) strong staining (3+), (b) intermediate staining (2+); c) UPS with PD-L1 positive TILs; d) UPS with double staining: red: PD-L1 positive lymphocytes, brown: CD163 positive histiocytes, intermingled negative TCs; (e) CD3+ TILs in high infiltration density; (f). UPS with scarce PD-1 positive TILs. 1 g)–1j) PD-L1 staining in representative high-grade sarcomas of soft tissue: (g) Epithelioid sarcoma, (e) Angiosarcoma, (f) Alveolar soft part sarcoma.

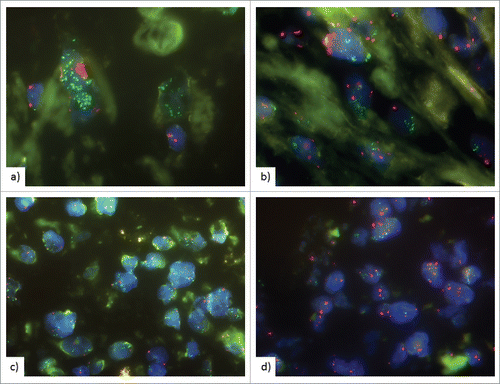
Figure 4. Fluorescence in situ hybridization (FISH) of PD-L1 gene locus. CD274/PD-L1 gene is labelled in green, centromer 9 in red. FISH analysis showing (a), (b) high level amplification with clusters of >15 PD-L1 signals in >10% of tumor nuclei, (c) high level amplification with PD-L1/CEP9 ratio ≥2.0 (d) Low-level amplification with clusters of >5 PD-L1 signals in >50% of tumor nuclei.

