Figures & data
Figure 1. Screening for T-cell responses towards minimal peptides derived from PD-L2. (A) Examples of ELISPOT results for PBMCs isolated from patients with malignant melanoma (AA and MM), in response to PD-L201 (PD-L24-12; LLLMLSLEL) and PD-L205 (PD-L216-25; QIAALFTVTV). (B) In-vitro IFN-γ ELISPOT results. PBMCs from 9 patients with malignant melanoma were stimulated once in vitro with each peptide. Then, the PBMCs were exposed to the peptides, and IFN-γ secretion was measured with ELISPOT. The response was calculated as the number of peptide-specific spots, minus the number of spots that reacted to an irrelevant peptide (HIV/HLA-A2; pol476-484; ILKEPVHGV), per5 × 105 PBMCs.
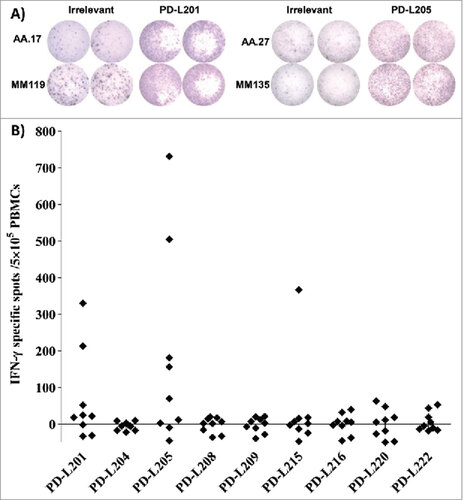
Figure 2. Natural T-cell responses towards two minimal PD-L2-derived epitopes in both patients with cancer and healthy donors. (A) Examples of IFN-γ responses against PD-L201 (PD-L24-12) and PD-L205 (PD-L216-25)(black bars) or irrelevant peptide (grey bars) in PBMCs from patients with malignant melanoma (AA and MM). All experiments were performed in triplicate, ## significant according to the DFR and DFR × 2. (B) Examples of TNF-α responses against PD-L201 (PD-L24-12) and PD-L205 (PD-L216-25) (black bars) or irrelevant peptide (grey bars) in PBMCs from patients with malignant melanoma (AA and MM), ## significant according to the DFR and DFR × 2; # significant according to only the DFR. (C) In-vitro IFN-γ ELISPOT results. PBMCs from 9 patients with malignant melanoma and 9 healthy donors were stimulated once in vitro with PD-L201 (PD-L24-12) or PD-L205 (PD-L216-25). Then, PBMCs were exposed to the peptides, and IFN-γ secretion was measured with ELISPOT. The average number of peptide-specific spots (after subtracting the number of spots without added peptide) was calculated per 2–5 × 10⁵ PBMCs. (D) Ex vivo IFN-γ ELISPOT results. PD-L205 (PD-L216-25)(black bars) or the irrelevant peptide (grey bars) elicited responses in PBMCs from two patients with malignant melanoma (AA) and in PBMCs from two healthy donors (HD).
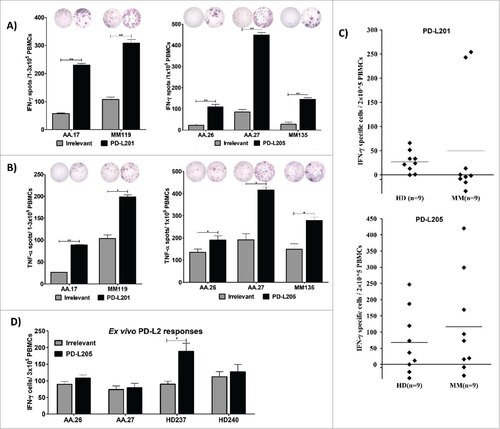
Figure 3. Reactivity towards long PD-L2 peptides spanning the signal peptide part of the PD-L2 sequence. (A) In vitro IFN-γ ELISPOT results. PBMCs from 11 patients with malignant melanoma and 11 healthy donors were stimulated with PD-L2long1 (PD-L29-29; SLELQLHQIAALFTVTVPKEL) or PD-L2long2 (PD-L21-25; MIFLLLMLSLELQLHQIAALFTVTV) and screened for IFNγ responses, by measuring IFNγ release in an in vitro ELISPOT assay. (B) PBMCs from four non-hodgkin lymphoma patients (WM) screened for IFN-γ responses towards PD-L2long2 (PD-L21-25) in an in vitro ELISPOT assay. All assays were made in triplicates with 3#10^6 cells per well, except one which were made in duplicates (WM-2). ## denotes as significant according to the DFR and DFR × 2; # denotes significant according to only the DFR. (C) Examples of ELISPOT well images for WM-5 patient in response to PD-L2long2. (D) Intracellular cytokine staining of tumor infiltrating T-lymphocytes (TILs) from two melanoma patients (TIL2, white bars and TIL6, black bars) shows CD4+ T cell release of IFN-Υ, upon exposure to PD-L2long1 (PD-L29-29), PD-L2long2 (PD-L21-25) and a control HIV peptide (HIV-1 pol476-484).
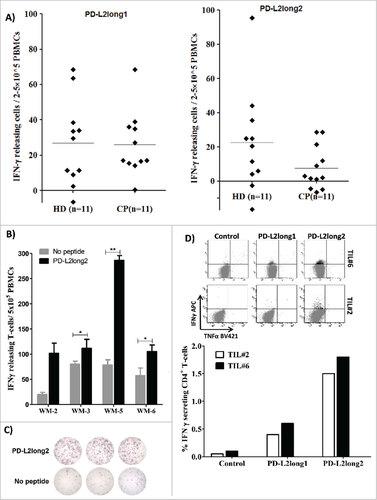
Figure 4. PD-L2-specific T cells are effector T cells. (A) Intracellular cytokine staining showing CD4+ and CD8+ T cells that release TNF-α in response to either an irrelevant control peptide HIV peptide (HIV-1 pol476-484) or PD-L205 (PD-L216-25) in cultures of PD-L2T cells-A (left,) and PD-L2T cells-B (right). (B) Intracellular TNF-α and IFN- γ cytokine staining of PD-L2T-cells culture-A (left) and PD-L2T-cells culture-B (right) in response to 5 hours stimulation with autologous DCs. (C) IFN-γ and TNF-α secretion by PD-L2T-cell culture-A (top) and PD-L2T-cell culture-B (bottom) towards PD-L205 (PD-L216-25) peptide (black bars) and autologous DCs when cultured at ratio 1:5 (grey bars) as measured by ELISPOT assay. (D) T2 cells pulsed either with PD-L205 (PD-L216-25) or a control HIV peptide (HIV-1 pol476-484) as recognized by by PD-L2T-cell culture-A (left) and PD-L2T-cell culture-B (right) in a standard 51Cr-release assay.
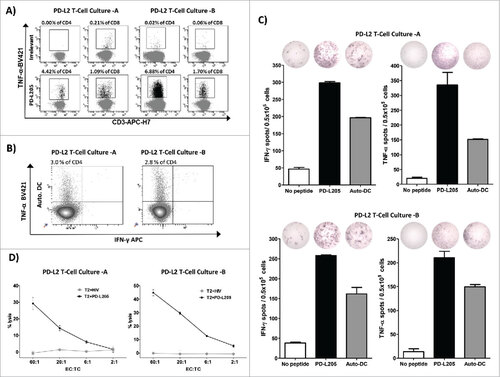
Figure 5. PD-L2 dependent reactivity towards DCs. (A) Flow cytometric analysis showing profile of PD-L2 surface expression on autologous DCs transfected with either PD-L2 siRNA or negative control siRNA, 48hr after electroporation. (B) PD-L2T-cells culture-A (top) and PD-L2T-cells culture-B (bottom) were stimulated with autologous DCs transfected PD-L2 siRNA or negative control siRNA for 5 hours at a ratio of 1:5 (DC:T-cell). Percentage of cytokine releasing CD4+ T cells (left) and CD8+ T cells (right) was measured using intracellular cytokine staining. (C) Number of TNF-α releasing T cells in PD-L2 cultures in response to autologous DCs transfected with either a negative control siRNA (black bars) or PD-L2 siRNA (grey bars) measured at 48 hours after electroporation using ELISPOT assay. The assay was performed in triplicate and # denotes significant according to the DFR.
Figure 6. No cross-reactivity between PD-L1-specific and PD-L2-specific T cells. (A) The first 30 amino acid sequences of PD-L1 and PD-L2 and the location of the peptides PD-L101 (PDL115-23; LLNAFTVTV) and PD-L205 (PD-L216-25; QIAALFTVTV) in the signal peptide part of the proteins are marked in bold. (B) In vitro IFN- γ ELISPOT results show responses of T cells from five patients with cancer towards PD-L101 (PDL115-23) and PD-L205 (PD-L216-25) peptides. (C) 51Cr-release assay results show percent lysis of T2 cells pulsed with PD-L101 (PDL115-23), PD-L205 (PD-L216-25), or an irrelevant HIV peptide (HIV-1 pol476-484) when exposed to PD-L101-specific T-cells (CTLs) at different effector-to-target ratios. (D) Intracellular cytokine staining of cultured PD-L101-specific T-cells shows CD8+ T cell release of TNF-α, upon exposure to PD-L101 (PDL115-23), PDL205 (PD-L216-25), or an irrelevant HIV peptide (HIV-1 pol476-484). (D) Percent lysis of T2-cells, pulsed with PDL205 (PD-L216-25), PD-L101 peptide (PDL115-23), or an irrelevant HIV peptide (HIV-1 pol476-484), after exposure to PD-L2T-cell culture-A (left) or PD-L2T-cell culture-B (right).