2,248
Views
19
CrossRef citations to date
0
Altmetric
Brief Report

Pro-inflammatory allogeneic DCs promote activation of bystander immune cells and thereby license antigen-specific T-cell responses

, , , , , ORCID Icon & show all
Article: e1395126 | Received 23 Aug 2017, Accepted 16 Oct 2017, Published online: 27 Nov 2017

Figures & data

Figure 1. COMBIG/Ad5M-matured DCs express a mature phenotype and Th1-polarized cytokine secretion profile. (A) CD14+ monocytes were isolated from healthy donor PBMCs, differentiated into imDCs by GM-CSF/IL-4 for 5 days, matured under different conditions for 18 h, washed and further cultured for 24 h and analyzed. (B) DCs were characterized for HLA-DR, CD40, CD80, CD86 and CD83 expression by flow cytometry. Mean fluorescence intensity (MFI) for each marker on DCs (CD14CD1a+) produced from eight donors are shown. (C) Secreted cytokines were assessed in supernatants of each treatment by proteome profiler where supernatants from six donors were pooled. (D) IL-12, IL-6 and CXCL10 secretion were also verified by ELISA for each donor. (E, F) Inflammasome activation was evaluated by the re-localization of the protein ASC, an inflammasome component, from a diffuse state to a single speck exhibited in representative FACS plots of ASC width (ASC-W) and ASC area (ASC-A) and % of speck+ DCs produced from six donors. Data are shown as mean±SEM (n.s. p ≥ 0.05; * P < 0.05; ** P < 0.01; *** P < 0.001; **** P < 0.0001).
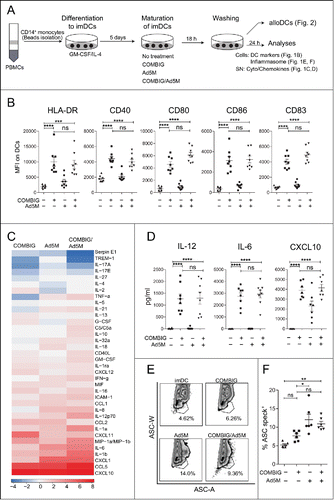
Figure 1. COMBIG/Ad5M-matured DCs express a mature phenotype and Th1-polarized cytokine secretion profile. (A) CD14+ monocytes were isolated from healthy donor PBMCs, differentiated into imDCs by GM-CSF/IL-4 for 5 days, matured under different conditions for 18 h, washed and further cultured for 24 h and analyzed. (B) DCs were characterized for HLA-DR, CD40, CD80, CD86 and CD83 expression by flow cytometry. Mean fluorescence intensity (MFI) for each marker on DCs (CD14−CD1a+) produced from eight donors are shown. (C) Secreted cytokines were assessed in supernatants of each treatment by proteome profiler where supernatants from six donors were pooled. (D) IL-12, IL-6 and CXCL10 secretion were also verified by ELISA for each donor. (E, F) Inflammasome activation was evaluated by the re-localization of the protein ASC, an inflammasome component, from a diffuse state to a single speck exhibited in representative FACS plots of ASC width (ASC-W) and ASC area (ASC-A) and % of speck+ DCs produced from six donors. Data are shown as mean±SEM (n.s. p ≥ 0.05; * P < 0.05; ** P < 0.01; *** P < 0.001; **** P < 0.0001).
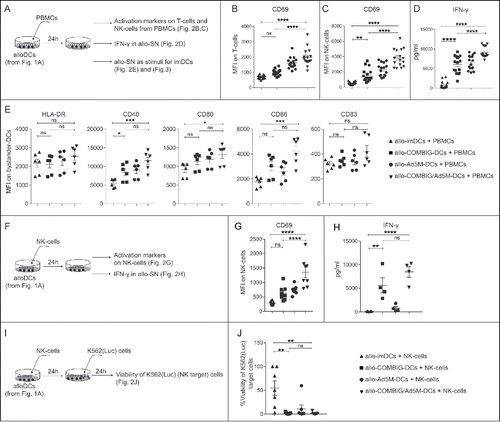
Figure 2. Allo-COMBIG/Ad5M-DCs activate innate and adaptive immune cells in vitro. (A) After maturation for 18 h and washing (samples as described in ) the DCs, here called alloDCs, were co-cultured with allogeneic PBMCs (meaning from a different donor). After 24 h of co-culture, activation of immune cells in the PBMC pool was characterized by the expression of CD69 on T-cells and NK-cells. Mean fluorescence intensities for CD69 on (B) T-cells (CD3+CD56) and (C) NK-cells (CD3CD56+) from sixteen individual combinations of eight unrelated donors are shown. (D) ELISA was used to measure the concentration of IFN-γ in the allogeneic co-culture supernatants, here called allo-SN. (E) The allo-SN from the alloDC-PBMC co-cultures was used as maturation stimuli for imDCs (DCs from the same donor as the PBMCs) to mimic a scenario for host “bystander” imDCs. Bystander-DC maturation was assessed by the upregulation of HLA-DR, CD40, CD80, CD86 and CD83 as shown in MFI scatter plots for each marker on bystander-DCs (CD14CD1a+). Six individual combinations from three unrelated donors were evaluated. (F) NK-cells isolated from PBMCs were co-cultured with alloDCs for 24 h. NK-cell activation was then verified by (G) CD69 expression on NK-cell surface (MFI) and (H) IFN-γ secretion in the generated allo-SN. (I) The killing ability of the activated NK-cells were further investigated by adding NK-target cells (K562(Luc)). The viability of K562(Luc) cells was assessed 24 h later. (J) Relative cell viability was calculated as the percentage of the luciferase activity from K562(Luc) cells alone (without addition of NK-cells). Experimental duplicates were used for each condition and results of eight individual combinations from four unrelated donors are shown. Data are shown as mean±SEM (n.s. p ≥ 0.05; * P < 0.05; ** P < 0.01; *** P < 0.001; **** P < 0.0001).

Figure 2. Allo-COMBIG/Ad5M-DCs activate innate and adaptive immune cells in vitro. (A) After maturation for 18 h and washing (samples as described in Figure 1A) the DCs, here called alloDCs, were co-cultured with allogeneic PBMCs (meaning from a different donor). After 24 h of co-culture, activation of immune cells in the PBMC pool was characterized by the expression of CD69 on T-cells and NK-cells. Mean fluorescence intensities for CD69 on (B) T-cells (CD3+CD56−) and (C) NK-cells (CD3−CD56+) from sixteen individual combinations of eight unrelated donors are shown. (D) ELISA was used to measure the concentration of IFN-γ in the allogeneic co-culture supernatants, here called allo-SN. (E) The allo-SN from the alloDC-PBMC co-cultures was used as maturation stimuli for imDCs (DCs from the same donor as the PBMCs) to mimic a scenario for host “bystander” imDCs. Bystander-DC maturation was assessed by the upregulation of HLA-DR, CD40, CD80, CD86 and CD83 as shown in MFI scatter plots for each marker on bystander-DCs (CD14−CD1a+). Six individual combinations from three unrelated donors were evaluated. (F) NK-cells isolated from PBMCs were co-cultured with alloDCs for 24 h. NK-cell activation was then verified by (G) CD69 expression on NK-cell surface (MFI) and (H) IFN-γ secretion in the generated allo-SN. (I) The killing ability of the activated NK-cells were further investigated by adding NK-target cells (K562(Luc)). The viability of K562(Luc) cells was assessed 24 h later. (J) Relative cell viability was calculated as the percentage of the luciferase activity from K562(Luc) cells alone (without addition of NK-cells). Experimental duplicates were used for each condition and results of eight individual combinations from four unrelated donors are shown. Data are shown as mean±SEM (n.s. p ≥ 0.05; * P < 0.05; ** P < 0.01; *** P < 0.001; **** P < 0.0001).

Figure 3. Activation and expansion of antigen-directed T-cells induced by cross-presentation of the antigen by autologous bystander-DCs matured by the allogeneic supernatant from PMBC and allo-COMBIG/Ad5M-DC co-cultures. (A) DCs from an HLA-A2+ donors (bystander-DCs) were pulsed for 2 h with lysate from tumor cells expressing the CMV-pp65 antigen (A549(pp65)) and matured for 38 h by allo-SN from the various co-cultures (). The cross-presenting bystander-DCs were then mixed for 18 h with autologous T-cells, engineered with a TCR against the HLA-A2-restricted CMV-pp65495–503 peptide. (B) ELISA was used to measure the concentration of IFN-γ released by the T-cells into the supernatants. Six individual combinations from three unrelated donors were examined. (C) Bystander-DCs from CMV-seropositive, HLA-A2+ donor were prepared as mentioned above and used to stimulate autologous T-cells (non-engineered) for 12 days in the presence of low dose IL-2 (20IU/ml). (D) CMV-pp65-specific T-cell expansion was quantified by flow cytometry using PE-conjugated HLA-A*0201/pp65495–503 tetramer. FACS plots from one representative individual combination out of four using the allo-SN from PBMC and allo-COMBIG/Ad5M-DC co-cultures as maturation stimuli are shown. (E) The expanded T-cells were then re-stimulated by exposure to T2 cells loaded either with CMV-pp65495–503 peptide (relevant target) or TARP4––13 peptide (irrelevant target). ELISA was used to measure the concentration of IFN-γ in supernatants harvested 18 h after re-stimulation. The dotted line indicates the background IFN-γ release from T-cells stimulated by immature bystander-DCs. Data are shown as mean±SEM (* P < 0.05; ** P < 0.01; **** P < 0.0001).
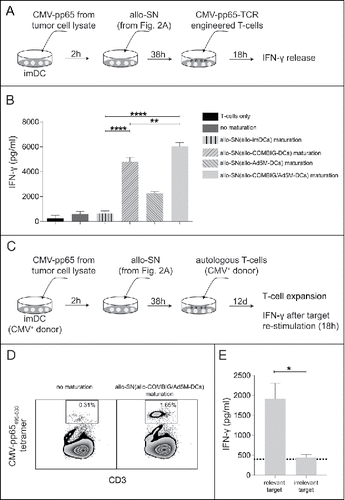
Figure 3. Activation and expansion of antigen-directed T-cells induced by cross-presentation of the antigen by autologous bystander-DCs matured by the allogeneic supernatant from PMBC and allo-COMBIG/Ad5M-DC co-cultures. (A) DCs from an HLA-A2+ donors (bystander-DCs) were pulsed for 2 h with lysate from tumor cells expressing the CMV-pp65 antigen (A549(pp65)) and matured for 38 h by allo-SN from the various co-cultures (Figure 2A). The cross-presenting bystander-DCs were then mixed for 18 h with autologous T-cells, engineered with a TCR against the HLA-A2-restricted CMV-pp65495–503 peptide. (B) ELISA was used to measure the concentration of IFN-γ released by the T-cells into the supernatants. Six individual combinations from three unrelated donors were examined. (C) Bystander-DCs from CMV-seropositive, HLA-A2+ donor were prepared as mentioned above and used to stimulate autologous T-cells (non-engineered) for 12 days in the presence of low dose IL-2 (20IU/ml). (D) CMV-pp65-specific T-cell expansion was quantified by flow cytometry using PE-conjugated HLA-A*0201/pp65495–503 tetramer. FACS plots from one representative individual combination out of four using the allo-SN from PBMC and allo-COMBIG/Ad5M-DC co-cultures as maturation stimuli are shown. (E) The expanded T-cells were then re-stimulated by exposure to T2 cells loaded either with CMV-pp65495–503 peptide (relevant target) or TARP4––13 peptide (irrelevant target). ELISA was used to measure the concentration of IFN-γ in supernatants harvested 18 h after re-stimulation. The dotted line indicates the background IFN-γ release from T-cells stimulated by immature bystander-DCs. Data are shown as mean±SEM (* P < 0.05; ** P < 0.01; **** P < 0.0001).
Supplemental material

Supplementary_figure_S1.tif

Download TIFF Image (704.1 KB)