2,122
Views
4
CrossRef citations to date
0
Altmetric
Original Research

Cancer vaccine based on a combination of an infection-enhanced adenoviral vector and pro-inflammatory allogeneic DCs leads to sustained antigen-specific immune responses in three melanoma models

, , , , , , ORCID Icon & show all
Article: e1397250 | Received 23 Aug 2017, Accepted 21 Oct 2017, Published online: 26 Dec 2017

Figures & data

Figure 1. AlloDCs injection results in migration of host DCs to the draining lymph node. (A) C57BL/6NRj (H2-Db) mice were injected intradermally (i.d.) on the right hind flank with 1×10⁶ alloDCs or Ad5M(gp100)-alloDCs, derived from BALB/c (H2-Dd) mice, and 20 μg CFSE (fluorescent cell-membrane dye). Activation and migration of host DCs to the draining lymph node was analyzed 48 h post-injection by flow cytometry. (B) The presence of migrated DCs was evaluated as % CFSE+ cells of CD11chighCD11b+B220 DCs in the draining (dLN) and non-draining (ndLN) lymph node. (C) Co-staining the CFSE+ DCs in the dLN with I-Ab, a C57BL/6NRj haplotype-specific antibody labelling only host DCs. Shown is the % of I-Ab+ cells of all CFSE+CD11b+B220 DCs. (D) The activation status (expression of the co-stimulatory molecule CD86) of the migrated CFSE-labelled DCs (CD11chighCD11b+B220) in dLN and ndLN was evaluated and presented as the ratio of CD86+/CD86 cells. (E) The activation status (expression of CD86) of migrated (CFSE+) and resident (CFSE) DCs (CD11chighCD11b+B220) in the dLN was also evaluated and presented as the ratio of CD86+/CD86 cells. Data are shown as mean±SEM (n.s. p≥0.05).

Figure 1. AlloDCs injection results in migration of host DCs to the draining lymph node. (A) C57BL/6NRj (H2-Db) mice were injected intradermally (i.d.) on the right hind flank with 1×10⁶ alloDCs or Ad5M(gp100)-alloDCs, derived from BALB/c (H2-Dd) mice, and 20 μg CFSE (fluorescent cell-membrane dye). Activation and migration of host DCs to the draining lymph node was analyzed 48 h post-injection by flow cytometry. (B) The presence of migrated DCs was evaluated as % CFSE+ cells of CD11chighCD11b+B220− DCs in the draining (dLN) and non-draining (ndLN) lymph node. (C) Co-staining the CFSE+ DCs in the dLN with I-Ab, a C57BL/6NRj haplotype-specific antibody labelling only host DCs. Shown is the % of I-Ab+ cells of all CFSE+CD11b+B220− DCs. (D) The activation status (expression of the co-stimulatory molecule CD86) of the migrated CFSE-labelled DCs (CD11chighCD11b+B220−) in dLN and ndLN was evaluated and presented as the ratio of CD86+/CD86− cells. (E) The activation status (expression of CD86) of migrated (CFSE+) and resident (CFSE−) DCs (CD11chighCD11b+B220−) in the dLN was also evaluated and presented as the ratio of CD86+/CD86− cells. Data are shown as mean±SEM (n.s. p≥0.05).
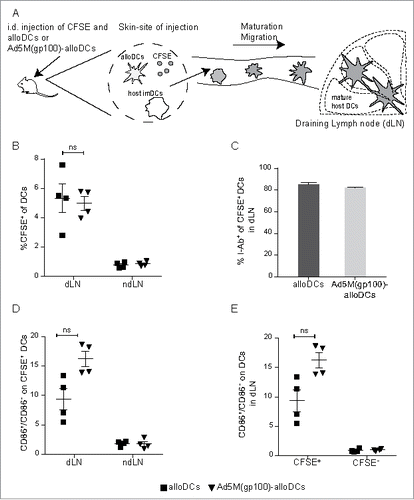
Figure 2. Combination treatment with alloDCs and an infection-enhanced adenoviral vector providing TAA results in efficient induction of endogenous TAA-specific T cells. (A) C57BL/6NRj mice were vaccinated s.c. in a prime (day 0) and boost (day 10) prophylactic setup with 5×10⁹ evg of Ad5M(gp100) either alone or after transduction of 1×10⁶ alloDCs. (B) Blood was collected one week later (day 17) and the presence of T cells (CD8a+CD3+) with a TCR for the human gp10025-33 epitope (gp100-TCR+) were analyzed with an H-2Db/hgp10025-33-PE tetramer in flow cytometry. Presence of gp100-TCR+ T cells was determined as positive if a distinct population above 0.5% of the parental CD8a+CD3 a+ population (cut off value for Ad5M(MOCK)) was observed. Shown is a chart with the number of mice with gp100-TCR+ T cells. (C, D, E) The vaccinated mice were then inoculated (day 18) with 2×10⁵ Hcmel12 cells, derived from a primary HGF-CDK4(R24C) melanomaCitation25 and tumor growth was monitored. Shown is a scatter plot representing the correlation of tumor size and % of gp100-TCR+ T cells at the time of the first recorded tumor-related death (day 40) for (C) all controls and treatments pooled (r = −0.3271, p = 0.0450), (D) mice treated with Ad5M(gp100) and control (r = −0.1256, p = 0.5681) and (E) mice treated with Ad5M(gp100)-alloDC and control (r = −0.5434, p = 0.0074). (F) For a therapeutic setting, C57BL/6NRj mice were inoculated with 5 ×10⁵ Hcmel3 cells, another primary HGF-CDK4(R24C) melanoma with slower growth kinetics,Citation26 and received three consecutive weekly i.t injections with 5×10⁹ evg Ad5M(gp100) alone or after transduction of 1×10⁶ alloDCs. Control mice were treated with 5×10⁹ evg Ad5M(MOCK) or 1×10⁶ alloDCs. (G) The presence of gp100-TCR+ T cells was evaluated by tetramer flow cytometry, one month after inoculation of tumors. (H) Scatter plot representing the correlation of tumor size and % of gp100-TCR+ T cells of CD3+ T cells (r = −0.5837, p = 0.0155) at the time of sacrifice.
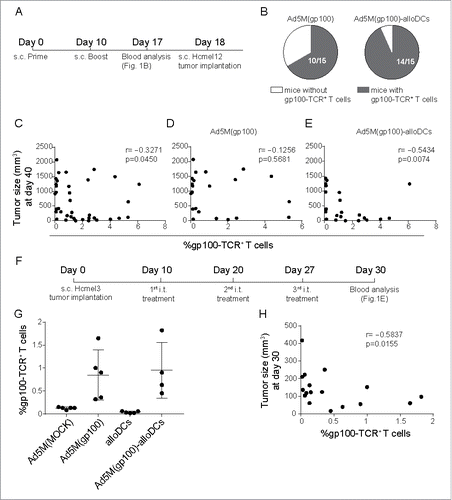
Figure 2. Combination treatment with alloDCs and an infection-enhanced adenoviral vector providing TAA results in efficient induction of endogenous TAA-specific T cells. (A) C57BL/6NRj mice were vaccinated s.c. in a prime (day 0) and boost (day 10) prophylactic setup with 5×10⁹ evg of Ad5M(gp100) either alone or after transduction of 1×10⁶ alloDCs. (B) Blood was collected one week later (day 17) and the presence of T cells (CD8a+CD3+) with a TCR for the human gp10025-33 epitope (gp100-TCR+) were analyzed with an H-2Db/hgp10025-33-PE tetramer in flow cytometry. Presence of gp100-TCR+ T cells was determined as positive if a distinct population above 0.5% of the parental CD8a+CD3 a+ population (cut off value for Ad5M(MOCK)) was observed. Shown is a chart with the number of mice with gp100-TCR+ T cells. (C, D, E) The vaccinated mice were then inoculated (day 18) with 2×10⁵ Hcmel12 cells, derived from a primary HGF-CDK4(R24C) melanomaCitation25 and tumor growth was monitored. Shown is a scatter plot representing the correlation of tumor size and % of gp100-TCR+ T cells at the time of the first recorded tumor-related death (day 40) for (C) all controls and treatments pooled (r = −0.3271, p = 0.0450), (D) mice treated with Ad5M(gp100) and control (r = −0.1256, p = 0.5681) and (E) mice treated with Ad5M(gp100)-alloDC and control (r = −0.5434, p = 0.0074). (F) For a therapeutic setting, C57BL/6NRj mice were inoculated with 5 ×10⁵ Hcmel3 cells, another primary HGF-CDK4(R24C) melanoma with slower growth kinetics,Citation26 and received three consecutive weekly i.t injections with 5×10⁹ evg Ad5M(gp100) alone or after transduction of 1×10⁶ alloDCs. Control mice were treated with 5×10⁹ evg Ad5M(MOCK) or 1×10⁶ alloDCs. (G) The presence of gp100-TCR+ T cells was evaluated by tetramer flow cytometry, one month after inoculation of tumors. (H) Scatter plot representing the correlation of tumor size and % of gp100-TCR+ T cells of CD3+ T cells (r = −0.5837, p = 0.0155) at the time of sacrifice.

Figure 3. The pro-inflammatory milieu induced by alloDCs recruits innate immune cells to the site of injection. (A) C57BL/6NRj mice were injected i.d. with 1×10⁶ alloDCs, along with 20 μg CFSE (green fluorescent cell-membrane dye) to be able to identify the injection site. Recruitment of innate immune cells at the site of injection was analyzed after 48 hours. (B-E) Recruitment of NK1.1+ NK cells (B, C) and Gr1+ neutrophils (D, E) to the site of injection in response to injected alloDCs was analyzed by immunofluorescent staining. Representative staining of one mouse per group is shown in B and D (green = injected area, blue = nuclei, red = NK1.1 or Gr1). Quantification of infiltrated NK-cells and neurophils (C, E) was determined as number of positive cells per mm2. Data are shown as mean±SEM (* P<0.05; ** P<0.01; *** P<0.001).
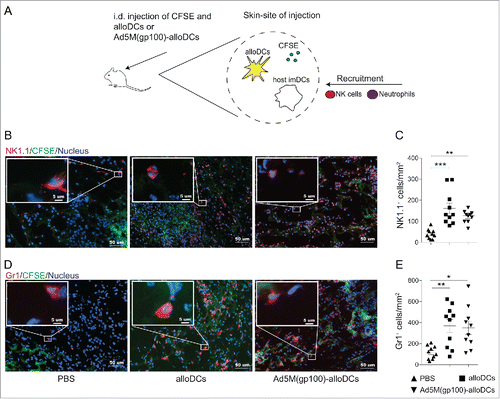
Figure 3. The pro-inflammatory milieu induced by alloDCs recruits innate immune cells to the site of injection. (A) C57BL/6NRj mice were injected i.d. with 1×10⁶ alloDCs, along with 20 μg CFSE (green fluorescent cell-membrane dye) to be able to identify the injection site. Recruitment of innate immune cells at the site of injection was analyzed after 48 hours. (B-E) Recruitment of NK1.1+ NK cells (B, C) and Gr1+ neutrophils (D, E) to the site of injection in response to injected alloDCs was analyzed by immunofluorescent staining. Representative staining of one mouse per group is shown in B and D (green = injected area, blue = nuclei, red = NK1.1 or Gr1). Quantification of infiltrated NK-cells and neurophils (C, E) was determined as number of positive cells per mm2. Data are shown as mean±SEM (* P<0.05; ** P<0.01; *** P<0.001).

Figure 4. Intratumoral injection with Ad5M(gp100)-alloDCs reduces the immunosuppressive melanoma tumor microenvironment. (A) C57BL/6NRj mice were injected s.c. into the right hind flank with 1×10⁵ B16-F10 cells (day 0) and received two consecutive i.t. injections of 1×10⁶ alloDCs, Ad5M(gp100)-alloDCs or PBS (negative control) on days 3 and 10. (B) The effect on the tumor microenvironment (TME) was investigated two days later (day 12) as changes in the ratio of monocytic to granulocytic myeloid-derived suppressor cells, i.e., Mo-MDSC(Ly6ChighLy6G)/Gr-MDSC(Ly6ClowLy6G+). Mean values from 5 individual mice per group are shown. (C) The CD4+FOXP3+ regulatory T cells were determined in the tumor by immunofluorescence staining and representative pictures for one mouse per group of each treatment are shown (green = CD4, red = FOXP3, blue = nuclei). (D) Evaluation was exhibited as changes in the ratio of CD4+FOXP3+/total CD4+ T cells. (E) Representative pictures of tumor infiltrating CD8a+ T cells (green = CD8a, blue = nuclei) and (F) quantification are shown. (G) Representative pictures of tumor infiltrating NK1.1+ NK cells (red = NK1.1, blue = nuclei) and quantification (H) are shown. Data are shown as mean±SEM ** P<0.01; *** P<0.001).
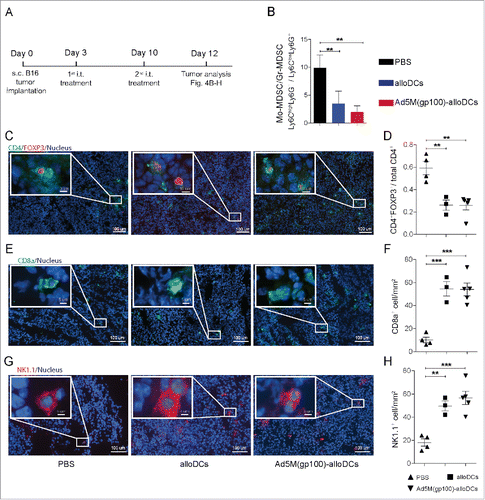
Figure 4. Intratumoral injection with Ad5M(gp100)-alloDCs reduces the immunosuppressive melanoma tumor microenvironment. (A) C57BL/6NRj mice were injected s.c. into the right hind flank with 1×10⁵ B16-F10 cells (day 0) and received two consecutive i.t. injections of 1×10⁶ alloDCs, Ad5M(gp100)-alloDCs or PBS (negative control) on days 3 and 10. (B) The effect on the tumor microenvironment (TME) was investigated two days later (day 12) as changes in the ratio of monocytic to granulocytic myeloid-derived suppressor cells, i.e., Mo-MDSC(Ly6ChighLy6G−)/Gr-MDSC(Ly6ClowLy6G+). Mean values from 5 individual mice per group are shown. (C) The CD4+FOXP3+ regulatory T cells were determined in the tumor by immunofluorescence staining and representative pictures for one mouse per group of each treatment are shown (green = CD4, red = FOXP3, blue = nuclei). (D) Evaluation was exhibited as changes in the ratio of CD4+FOXP3+/total CD4+ T cells. (E) Representative pictures of tumor infiltrating CD8a+ T cells (green = CD8a, blue = nuclei) and (F) quantification are shown. (G) Representative pictures of tumor infiltrating NK1.1+ NK cells (red = NK1.1, blue = nuclei) and quantification (H) are shown. Data are shown as mean±SEM ** P<0.01; *** P<0.001).

Figure 5. The combination of intratumoral administration of Ad5M(gp100)-alloDCs and adoptive transfer of pmel-1 T cells leads to prolonged survival of B16-F10 tumor-bearing mice. (A) The ability of Ad5M(gp100)-alloDCs to indirectly stimulate gp100-specific T cells in non-tumor-bearing mice was assessed by combining s.c. injection of Ad5M(gp100)-alloDCs (day 0) with i.v. adoptive cell transfer of gp100-specific Thy1.1+ pmel-1 splenocytes (day 2). T-cell read out was performed five days later by Thy1.1 staining (day 7). (B) Representative scatter plots of the specific proliferation of Thy1.1+ pmel-1 T cells (Thy1.1+) in response to alloDCs or Ad5M(gp100)-alloDCs from two mice are shown. (C) In a therapeutic setting, C57BL/6NRj mice were first injected s.c. into the hind flank with 1×10⁵ B16-F10 cells (day 0) and received 1×10⁷ pmel-1 splenocytes i.v. (day 8). The treatment was combined with i.t. injections of 1×10⁶ Ad5M(gp100)-alloDCs (day 8 and 14) or PBS as negative control. Tumor growth was monitored by caliper measurement. (D) Average tumor growth is presented for each treatment (n = 8 per group). (E) Mice survival is shown by the Kaplan-Meier survival curve and compared by log-rank test (n = 8 per group) (* P<0.05). (F-K) Mice were sacrificed two days after the last treatment (day 16) for immunological systemic and tumor analyses. Systemic presence of pmel-1 T cells was verified as % Thy1.1+Vβ13+ of CD8a+ T cells in (F) spleen, (G) dLN and (H) blood. (I) The effect of each treatment on the TME was evaluated day 16 post B16-F10 inoculation. It is presented as the ratio of Mo-MDSC/Gr-MDSC; mean values from 5 individual mice per group are shown. Infiltration of CD8a+ T cells in the tumor is shown as (J) % CD8a+ of CD3+ T cells and exhausted CD8a+ T cells as (K) % PD1+Tim3+ double positive cells of CD8a+ T cells. Data are shown as mean±SEM (* P<0.05; ** P<0.01; *** P<0.001; **** P<0.0001).
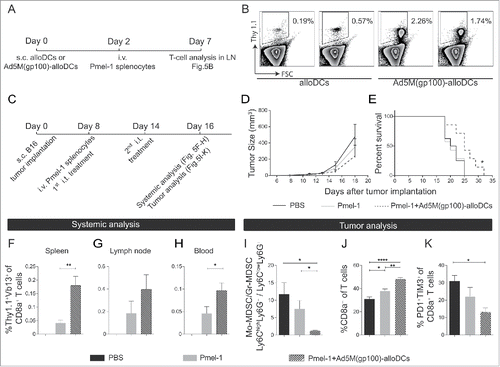
Figure 5. The combination of intratumoral administration of Ad5M(gp100)-alloDCs and adoptive transfer of pmel-1 T cells leads to prolonged survival of B16-F10 tumor-bearing mice. (A) The ability of Ad5M(gp100)-alloDCs to indirectly stimulate gp100-specific T cells in non-tumor-bearing mice was assessed by combining s.c. injection of Ad5M(gp100)-alloDCs (day 0) with i.v. adoptive cell transfer of gp100-specific Thy1.1+ pmel-1 splenocytes (day 2). T-cell read out was performed five days later by Thy1.1 staining (day 7). (B) Representative scatter plots of the specific proliferation of Thy1.1+ pmel-1 T cells (Thy1.1+) in response to alloDCs or Ad5M(gp100)-alloDCs from two mice are shown. (C) In a therapeutic setting, C57BL/6NRj mice were first injected s.c. into the hind flank with 1×10⁵ B16-F10 cells (day 0) and received 1×10⁷ pmel-1 splenocytes i.v. (day 8). The treatment was combined with i.t. injections of 1×10⁶ Ad5M(gp100)-alloDCs (day 8 and 14) or PBS as negative control. Tumor growth was monitored by caliper measurement. (D) Average tumor growth is presented for each treatment (n = 8 per group). (E) Mice survival is shown by the Kaplan-Meier survival curve and compared by log-rank test (n = 8 per group) (* P<0.05). (F-K) Mice were sacrificed two days after the last treatment (day 16) for immunological systemic and tumor analyses. Systemic presence of pmel-1 T cells was verified as % Thy1.1+Vβ13+ of CD8a+ T cells in (F) spleen, (G) dLN and (H) blood. (I) The effect of each treatment on the TME was evaluated day 16 post B16-F10 inoculation. It is presented as the ratio of Mo-MDSC/Gr-MDSC; mean values from 5 individual mice per group are shown. Infiltration of CD8a+ T cells in the tumor is shown as (J) % CD8a+ of CD3+ T cells and exhausted CD8a+ T cells as (K) % PD1+Tim3+ double positive cells of CD8a+ T cells. Data are shown as mean±SEM (* P<0.05; ** P<0.01; *** P<0.001; **** P<0.0001).
Supplemental material