Figures & data
Figure 1. BRD expression in MPM. (A) Oncoprint map of BRD gene amplification, up- and down-regulation in MPM samples analyzed by the TCGA-MESO database (n = 87). Data were obtained through the cBioPortal (http://www.cbioportal.org). (B) mRNA expression of BRD2, BRD3, BRD4 and BRD9 was detected in triplicates by real-time PCR in HMC and MPM cells. *p < 0.05: mean±SEM expression for BRD2 in epithelioid (epi), biphasic (bip) and sarcomatoid (sar) MPM samples vs mean±SEM expression in HMC (3.19±0.84 vs 1.29±0.08); not significant for BRD3 (6.52±2.92 vs 1.93±0.65); **p < 0.01 for BRD4 (4.56±1.06 vs 1.26±0.38); ***p < 0.001 for BRD9 (10.19±1.87 vs 1.83±0.39).
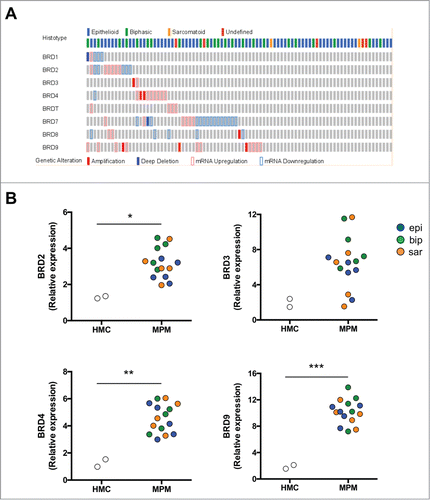
Figure 2. Antiproliferative effects of JQ1 on MPM patient derived cell lines. (A) MPM cells were incubated for 10 days at the indicated concentrations of JQ1, then stained with crystal violet solution (n = 3). Representative photographs of epithelioid (epi), biphasic (bip) and sarcomatoid (sar) MPM samples. (B) MPM cells were left untreated (ctrl) or incubated with JQ1 at the indicated concentrations. Proliferation rate was measured at day (D) 1, 3 and 6 in triplicates. Data of MPM samples (epi: epithelioid; bip: biphasic; sar: sarcomatoid) are means±SEM. *p < 0.05: JQ1-treated vs untreated MPM cells (D6). (C) Cells were incubated for 24 h (not shown) or 48 h in medium containing DMSO (ctrl) or 250 nM JQ1, then analyzed for cell cycle distribution in duplicates. Data of MPM samples are means±SEM. *p < 0.05; **p < 0.01; ***p < 0.001: JQ1-treated vs untreated MPM cells. The results after 24 h-treatment were superimposable (not shown). (D) MPM cells were incubated as reported in (C) for 72 h. The percentage of apoptotic cells was measured by TMRM assay in duplicates. Data of MPM samples (epi: epithelioid; bip: biphasic; sar: sarcomatoid) are means±SEM.
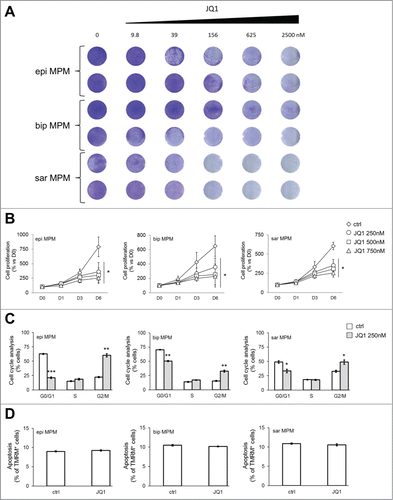
Figure 3. JQ1 primes MPM cells for immunogenic cell death and raises an adaptive anti-tumor immune response. (A, B) ATP release was measured by a chemiluminescent-based assay, HMGB1 release was measured by ELISA in the supernatant of cells incubated for 6 days in medium containing DMSO (ctrl) or 250 nM JQ1. Pooled data of MPM samples (epi: epithelioid; bip: biphasic; sar: sarcomatoid) are means±SEM. For both panels: **p < 0.01: MPM cells vs HMC ctrl; °p < 0.05: JQ1-treated cells vs respective untreated cells. (C, D) Representative histograms of surface calreticulin (CRT) and ERp57, obtained by flow cytometry, in cells incubated as indicated in (A, B). The percentage of CRT/ERp57-positive cells treated with JQ1 is indicated. Mean fluorescence intensity±SEM of pooled data for CRT: HMC ctrl: 3.3±1.2; HMC JQ1: 5.1±2.1; epi MPM ctrl: 2.1±0.6; epi MPM JQ1: 18.9±1.9; bip MPM ctrl: 2.0±0.7; bip MPM JQ1: 25.7±2.5; sar MPM ctrl: 2.3±0.8; sar MPM JQ1: 21.3±2.1. Mean fluorescence intensity±SEM of pooled data for ERp57: HMC ctrl: 2.3±0.2; HMC JQ1: 3.3±1.0; epi MPM ctrl: 2.5±0.4; epi MPM JQ1: 15.9±2.9; bip MPM ctrl: 3.2±0.5; bip MPM JQ1: 21.4±2.8; sar MPM ctrl: 2.8±0.4; sar MPM JQ1: 18.9±3.4. Significance for both CRT and ERp57: p < 0.001: MPM cells vs HMC ctrl; p < 0.001: JQ1-treated cells vs respective untreated cells. Blank: non-immune isotypic antibody. (E) Cells were incubated as indicated in (A, B), then stained with PKH2-Green FITC, incubated at 1:1 ratio for 18 h at 37 °C with DC labelled with an anti-HLA-DR antibody (APC-conjugated). PKH2-Green FITC/HLA-DR APC-positive cells, i.e. DC that have phagocytized MPM cells, were counted by flow cytometry. Pooled data of MPM samples are means±SEM. *p < 0.05; **p < 0.01; ***p < 0.001: MPM cells vs HMC ctrl; °°°p < 0.001: JQ1-treated cells vs respective untreated cells. (F) The amount of proliferating T-cells co-cultured 6 days with HMC or MPM cells, treated as reported in (A, B), was measured by labelling them with [3H]-thymidine. As positive control of proliferation, PBMC were treated with the anti-CD3 and anti-CD28 antibodies; as negative control, the PBMC were grown in medium alone. Pooled data of MPM samples are means±SEM. *p < 0.05; **p < 0.01: MPM cells vs HMC ctrl; °°°p < 0.001: JQ1-treated cells vs respective untreated cells. (G) After 10 days of co-culture with DC that have phagocytized HMC or MPM cells, IFN-γ was measured by ELISA in the supernatant of CD3+ CD8+ T-cells. Pooled data of MPM samples are means±SEM. *p < 0.05; **p < 0.01; ***p < 0.001: MPM cells vs HMC ctrl; °°°p < 0.001: JQ1-treated cells vs respective untreated cells. (H) Representative dot plots of CD8+ CD107+ T-lymphocytes, isolated from T-cells co-cultured with DC as reported in (G), determined by flow cytometry. Mean fluorescence intensity±SEM of pooled data: HMC ctrl: 2.4±0.2; HMC JQ1: 3.0±0.3; epi MPM ctrl: 1.3±0.4; epi MPM JQ1: 6.3±0.5; bip MPM ctrl: 1.5±0.3; bip MPM JQ1: 6.2±0.8; sar MPM ctrl: 1.4±0.1; sar MPM JQ1: 8.2±1.2. Significance: p<0.001: MPM cells vs HMC ctrl; p < 0.001: JQ1-treated cells vs respective untreated cells.
![Figure 3. JQ1 primes MPM cells for immunogenic cell death and raises an adaptive anti-tumor immune response. (A, B) ATP release was measured by a chemiluminescent-based assay, HMGB1 release was measured by ELISA in the supernatant of cells incubated for 6 days in medium containing DMSO (ctrl) or 250 nM JQ1. Pooled data of MPM samples (epi: epithelioid; bip: biphasic; sar: sarcomatoid) are means±SEM. For both panels: **p < 0.01: MPM cells vs HMC ctrl; °p < 0.05: JQ1-treated cells vs respective untreated cells. (C, D) Representative histograms of surface calreticulin (CRT) and ERp57, obtained by flow cytometry, in cells incubated as indicated in (A, B). The percentage of CRT/ERp57-positive cells treated with JQ1 is indicated. Mean fluorescence intensity±SEM of pooled data for CRT: HMC ctrl: 3.3±1.2; HMC JQ1: 5.1±2.1; epi MPM ctrl: 2.1±0.6; epi MPM JQ1: 18.9±1.9; bip MPM ctrl: 2.0±0.7; bip MPM JQ1: 25.7±2.5; sar MPM ctrl: 2.3±0.8; sar MPM JQ1: 21.3±2.1. Mean fluorescence intensity±SEM of pooled data for ERp57: HMC ctrl: 2.3±0.2; HMC JQ1: 3.3±1.0; epi MPM ctrl: 2.5±0.4; epi MPM JQ1: 15.9±2.9; bip MPM ctrl: 3.2±0.5; bip MPM JQ1: 21.4±2.8; sar MPM ctrl: 2.8±0.4; sar MPM JQ1: 18.9±3.4. Significance for both CRT and ERp57: p < 0.001: MPM cells vs HMC ctrl; p < 0.001: JQ1-treated cells vs respective untreated cells. Blank: non-immune isotypic antibody. (E) Cells were incubated as indicated in (A, B), then stained with PKH2-Green FITC, incubated at 1:1 ratio for 18 h at 37 °C with DC labelled with an anti-HLA-DR antibody (APC-conjugated). PKH2-Green FITC/HLA-DR APC-positive cells, i.e. DC that have phagocytized MPM cells, were counted by flow cytometry. Pooled data of MPM samples are means±SEM. *p < 0.05; **p < 0.01; ***p < 0.001: MPM cells vs HMC ctrl; °°°p < 0.001: JQ1-treated cells vs respective untreated cells. (F) The amount of proliferating T-cells co-cultured 6 days with HMC or MPM cells, treated as reported in (A, B), was measured by labelling them with [3H]-thymidine. As positive control of proliferation, PBMC were treated with the anti-CD3 and anti-CD28 antibodies; as negative control, the PBMC were grown in medium alone. Pooled data of MPM samples are means±SEM. *p < 0.05; **p < 0.01: MPM cells vs HMC ctrl; °°°p < 0.001: JQ1-treated cells vs respective untreated cells. (G) After 10 days of co-culture with DC that have phagocytized HMC or MPM cells, IFN-γ was measured by ELISA in the supernatant of CD3+ CD8+ T-cells. Pooled data of MPM samples are means±SEM. *p < 0.05; **p < 0.01; ***p < 0.001: MPM cells vs HMC ctrl; °°°p < 0.001: JQ1-treated cells vs respective untreated cells. (H) Representative dot plots of CD8+ CD107+ T-lymphocytes, isolated from T-cells co-cultured with DC as reported in (G), determined by flow cytometry. Mean fluorescence intensity±SEM of pooled data: HMC ctrl: 2.4±0.2; HMC JQ1: 3.0±0.3; epi MPM ctrl: 1.3±0.4; epi MPM JQ1: 6.3±0.5; bip MPM ctrl: 1.5±0.3; bip MPM JQ1: 6.2±0.8; sar MPM ctrl: 1.4±0.1; sar MPM JQ1: 8.2±1.2. Significance: p<0.001: MPM cells vs HMC ctrl; p < 0.001: JQ1-treated cells vs respective untreated cells.](/cms/asset/89ee5389-bc0e-4e0f-8109-e635edf57328/koni_a_1398874_f0003_oc.gif)
Figure 4. JQ1 prevents the decrease of CD8+ T-lymphocytes and the increase of granulocytic-/monocytic-derived myeloid derived suppressor cells induced by MPM cells. (A) Representative dot plots of CD3+ CD8+ T-lymphocytes, isolated from PBMC after 6-days co-culture with HMC or MPM cells (epi: epithelioid; bip: biphasic; sar: sarcomatoid), in medium containing DMSO (ctrl) or 250 nM JQ1, as per flow cytometry. (B) Representative dot plots of Gr-MDSC, isolated from HLA-DR− CD14− CD11b+ PBMC co-cultured as in (A). To identify Gr-MDSC, first HLA-DR− CD11b+ cells were gated (R1), then CD14− CD11b+ cells (R2 on R1, not shown). This cell population was used to identify CD11b+ CD15+ cells. Gating of CD11b+ CD15+ is shown. (C) Representative dot plots of Mo-MDSC, isolated from HLA-DR− CD15low CD11b+ PBMC co-cultured as in (A). Specifically to identify Mo-MDSC, first HLA-DR− CD11b+ cells (R1) were gated, then CD15low CD11b+ cells (R2 on R1, not shown). This cell population was used to identify CD11b+ CD14+ cells. Gating of CD11b+ CD14+ cells is shown.
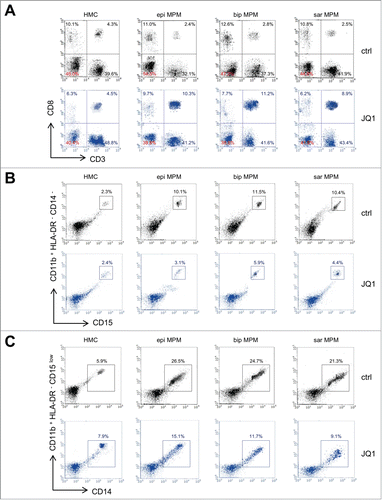
Table 1. Immune phenotype analysis of immune cells co-cultured with HMC and MPM cells treated with JQ1.
Figure 5. JQ1 reduces the levels of PD-1/PD-L1 and LAG-3 in CD8+ T-lymphocytes and in MPM cells. (A, B) Representative dot plots of CD8+ PD-1+ and CD8+ LAG-3+ T-lymphocytes, isolated from PBMC after 6-days co-culture with HMC or MPM cells (epi: epithelioid; bip: biphasic; sar: sarcomatoid), in medium containing DMSO (ctrl) or 250 nM JQ1, determined by flow cytometry. (C) Representative dot plots of PD-L1+ and LAG-3+ HMC or MPM cells, incubated for 6 days in medium containing DMSO (ctrl) or 250 nM JQ1.
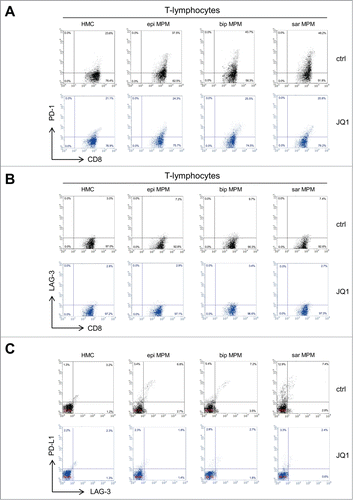
Table 2. Immune checkpoints expression on CD3+ CD8+ T-lymphocytes co-cultured with HMC and MPM cells treated with JQ1.
Table 3. Immune checkpoints expression on HMC and MPM cells treated with JQ1.
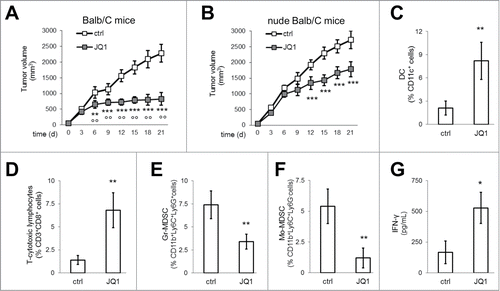
Figure 6. JQ1 delays MPM growth and reduces the immune-suppressive tumor-infiltrating cells. (A, B) Six week-old female immunocompetent or nude Balb/C mice were inoculated subcutaneously with 1 × 10⁷ AB1 cells and treated as detailed under Materials and methods. Tumor growth data are means±SEM (n = 15/group). **p < 0.01; ***p < 0.001: JQ1-treated vs. untreated animals; °°p < 0.01: JQ1-treated immunocompetent animals vs JQ1-treated nude animals. (C-F) After digestion of tumors from immunocompetent mice, single cell suspension was analyzed by flow cytometry to measure the percentage of DC, CD3+ CD8+ T-lymphocytes, Gr-MDSC, Mo-MDSC. Data are means±SEM. **p < 0.01: JQ1-treated animals vs untreated animals. (G) IFN-γ was measured by ELISA in the supernatant of tumor-draining lymph nodes of immunocompetent mice. Data are means±SEM. *p < 0.05: JQ1-treated animals vs untreated animals.
