1,285
Views
0
CrossRef citations to date
0
Altmetric
Original Research

Cellular vaccination of MLH1−/− mice – an immunotherapeutic proof of concept study

, , , , , & show all
Article: e1408748 | Received 26 Sep 2017, Accepted 18 Nov 2017, Published online: 14 Dec 2017

Figures & data

Figure 1. Comparative mutational analysis of MLH1−/− GIT and allograft. (A) The statistics of each mutation type (missense, nonsense and silent) are shown for the MLH1−/− GIT allograft and the primary tumor as well as the exclusive distribution for each. Silent mutations are dominating both samples and missense mutations are equally distributed. (B) Ideogram plots showing the genomic distributions of the missense mutations occurring in the annotated/known genes for both samples. All missense SNVs for MLH1−/− GIT allograft and the primary tumor are shown in blue and yellow respectively with their corresponding coordinate on the mouse reference genome mm9 cytoband. The exclusive missense SNVs for the MLH1−/− GIT allograft and the primary tumor are shown in red and annotated with a corresponding ID containing the SNV position and the affected gene name. (C) and (D) Missense mutations mapped on human protein sequences for the FHIT and the NF1 genes, respectively. These two specific genes are frequently mutated in CMMR-D related diseases.
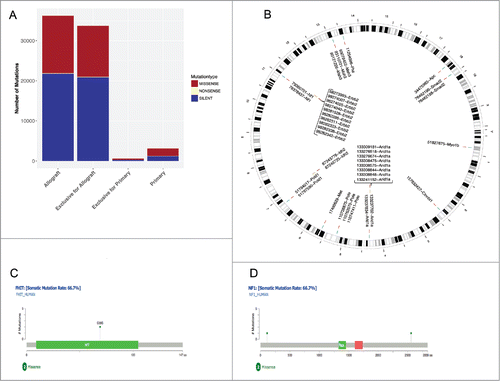
Figure 1. Comparative mutational analysis of MLH1−/− GIT and allograft. (A) The statistics of each mutation type (missense, nonsense and silent) are shown for the MLH1−/− GIT allograft and the primary tumor as well as the exclusive distribution for each. Silent mutations are dominating both samples and missense mutations are equally distributed. (B) Ideogram plots showing the genomic distributions of the missense mutations occurring in the annotated/known genes for both samples. All missense SNVs for MLH1−/− GIT allograft and the primary tumor are shown in blue and yellow respectively with their corresponding coordinate on the mouse reference genome mm9 cytoband. The exclusive missense SNVs for the MLH1−/− GIT allograft and the primary tumor are shown in red and annotated with a corresponding ID containing the SNV position and the affected gene name. (C) and (D) Missense mutations mapped on human protein sequences for the FHIT and the NF1 genes, respectively. These two specific genes are frequently mutated in CMMR-D related diseases.

Table 1. Tumor development after prophylactic vaccination and tumor spectrum.

Table 2. Analysis of coding microsatellite mutations in GIT from vaccinated and control tumors in comparing to the allograft, which was used for vaccination.

Figure 2. Prophylactic vaccination of MLH1−/ mice with a cellular lysate. (A) Flow cytometric phenotyping of peripheral blood leukocytes. Blood samples were taken at start of treatment ( = day 0) and regularly during the experiment. Given are the percentage numbers of positively stained cells as determined by gating on viable cells from vaccinated (lysate (n = 12) +/− CpG ODN 1826 (n = 15) and ODN control (n = 12)) and control mice (CpG ODN 1826or control ODN 1826; n = 9 and n = 7 mice per group, respectively). Values are given as mean ± SD; *p < 0.05 vs. control; t-test. (B) Kaplan Meier survival curve of vaccinated and control MLH1−/− mice. Log rank survival analysis, p = 0.017 Lysate + CpG ODN vs. control.
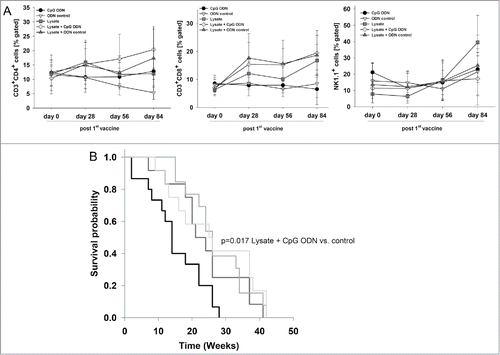
Figure 2. Prophylactic vaccination of MLH1−/− mice with a cellular lysate. (A) Flow cytometric phenotyping of peripheral blood leukocytes. Blood samples were taken at start of treatment ( = day 0) and regularly during the experiment. Given are the percentage numbers of positively stained cells as determined by gating on viable cells from vaccinated (lysate (n = 12) +/− CpG ODN 1826 (n = 15) and ODN control (n = 12)) and control mice (CpG ODN 1826or control ODN 1826; n = 9 and n = 7 mice per group, respectively). Values are given as mean ± SD; *p < 0.05 vs. control; t-test. (B) Kaplan Meier survival curve of vaccinated and control MLH1−/− mice. Log rank survival analysis, p = 0.017 Lysate + CpG ODN vs. control.

Figure 3. Immunofluorescence of MLH1−/ tumors and IFNγ–ELISpot after prophylactic vaccination. (A) Tumor microenvironment was studied from GIT cryostat sections of 4µm. Analyses were done on a laser scanning microscope (Zeiss) using 20x objectives. (B) Reactivity of PBL (during vaccination) or splenocytes (endpoint) against target cells (MLH1−/− 7450 T1 M1, MLH1−/− 328, and YAC-1) was examined after overnight co-incubation. Lymphocytes were isolated from vaccinated and control mice at different time points. Experiments revealed increased reactivity upon vaccination. Values are given as mean ± SD.
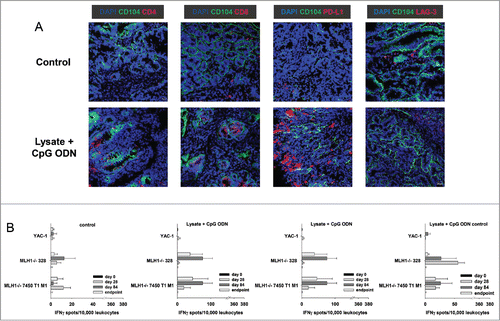
Figure 3. Immunofluorescence of MLH1−/− tumors and IFNγ–ELISpot after prophylactic vaccination. (A) Tumor microenvironment was studied from GIT cryostat sections of 4µm. Analyses were done on a laser scanning microscope (Zeiss) using 20x objectives. (B) Reactivity of PBL (during vaccination) or splenocytes (endpoint) against target cells (MLH1−/− 7450 T1 M1, MLH1−/− 328, and YAC-1) was examined after overnight co-incubation. Lymphocytes were isolated from vaccinated and control mice at different time points. Experiments revealed increased reactivity upon vaccination. Values are given as mean ± SD.

Figure 4. Therapeutic vaccination of MLH1−/ mice with a cellular lysate. (A) Comparative flow cytometric analyses from young and old mice for determining immune status prior to vaccination. * p<0.05 vs. young mice; t-test. (B) Tumor volume as determined by PET/CT in vivo imaging using radiopharmacon 18F-FDG. Values are given as mean ± SD. Whiskers (error bars) above and below the box indicate the 90th and 10th percentiles. (C) and (D) PET/CT in vivo imaging. Tumor nodules were visualized using radiopharmacom 18F-FDG. Given are representative summed images in axial (left) and coronal view (right) (C) For comparison, exemplary images of a tumor-free mouse as well as mice with a GIT and lymphoma are shown. Arrows indicate detected tumors. The color scale indicates SUV. (D) Repeated imaging at day 28 after vaccine revealed disappearance of single tumor nodules. Images at day 28 were taken from the same mouse as on day 0. (E) Kaplan Meier survival curve of vaccinated and control MLH1−/− mice. Log rank survival analysis. p<0.001 vs. control. p = 0.38 lysate vs. lysate + CpG ODN.
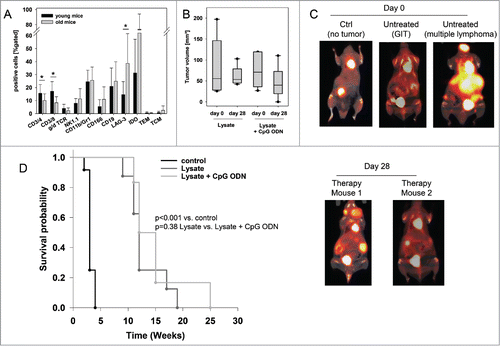
Figure 4. Therapeutic vaccination of MLH1−/− mice with a cellular lysate. (A) Comparative flow cytometric analyses from young and old mice for determining immune status prior to vaccination. * p<0.05 vs. young mice; t-test. (B) Tumor volume as determined by PET/CT in vivo imaging using radiopharmacon 18F-FDG. Values are given as mean ± SD. Whiskers (error bars) above and below the box indicate the 90th and 10th percentiles. (C) and (D) PET/CT in vivo imaging. Tumor nodules were visualized using radiopharmacom 18F-FDG. Given are representative summed images in axial (left) and coronal view (right) (C) For comparison, exemplary images of a tumor-free mouse as well as mice with a GIT and lymphoma are shown. Arrows indicate detected tumors. The color scale indicates SUV. (D) Repeated imaging at day 28 after vaccine revealed disappearance of single tumor nodules. Images at day 28 were taken from the same mouse as on day 0. (E) Kaplan Meier survival curve of vaccinated and control MLH1−/− mice. Log rank survival analysis. p<0.001 vs. control. p = 0.38 lysate vs. lysate + CpG ODN.

Figure 5. Immune status of therapeutically vaccinated mice. Flow cytometric phenotyping of peripheral blood leukocytes. Blood samples were taken at start of treatment ( = day 0) and regularly during the experiment. Given are the percentage numbers of positively stained cells as determined by gating on viable cells from vaccinated (lysate (n = 9) +/− CpG ODN 1826 (n = 7). Values are given as mean ± SD; *p < 0.05 lysate vs. day 0; t-test; # p < 0.05 vs. lysate + CpG ODN vs. day 0; t-test.
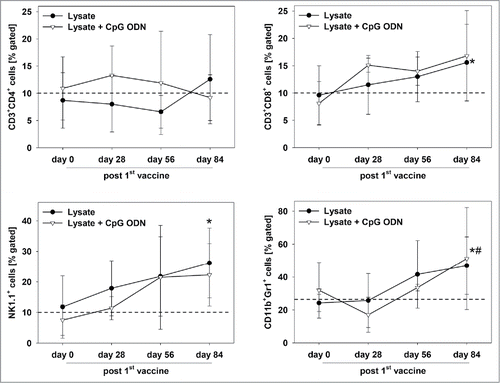
Figure 5. Immune status of therapeutically vaccinated mice. Flow cytometric phenotyping of peripheral blood leukocytes. Blood samples were taken at start of treatment ( = day 0) and regularly during the experiment. Given are the percentage numbers of positively stained cells as determined by gating on viable cells from vaccinated (lysate (n = 9) +/− CpG ODN 1826 (n = 7). Values are given as mean ± SD; *p < 0.05 lysate vs. day 0; t-test; # p < 0.05 vs. lysate + CpG ODN vs. day 0; t-test.

Figure 6. Immunofluorescence of MLH1−/ tumors after therapeutic vaccination. Tumor microenvironment was studied from GIT cryostat sections of 4µm. Pictures were done on a laser scanning microscope (Zeiss) using 20x objectives.
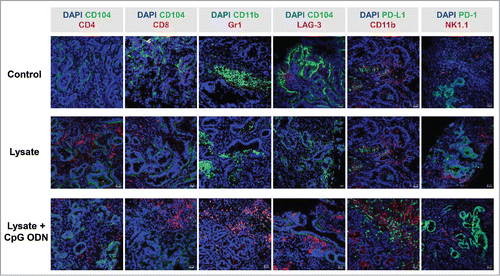
Figure 6. Immunofluorescence of MLH1−/− tumors after therapeutic vaccination. Tumor microenvironment was studied from GIT cryostat sections of 4µm. Pictures were done on a laser scanning microscope (Zeiss) using 20x objectives.

Figure 7. Functional immunological analysis. (A) IFNγ−ELISpot and (B) Flow cytometric cytotoxicity assay. (A) Reactivity of PBL (during vaccination) or splenocytes (endpoint) against target cells (MLH1−/− 7450 T1 M1, MLH1−/− 328, and YAC-1) was examined after overnight co-incubation. Lymphocytes were isolated from lysate-treated and control mice at different time points. These experiments identified increased reactivity post treatment. (B) Lytic activity of splenocytes against target cells (MLH1−/− 7450 T1 M1, MLH1−/− 328, and YAC-1) was examined after 12h co-incubation. Lymphocytes were isolated from spleens of lysate-treated and control mice. Again, an increased lytic activity upon vaccination was seen. Values are given as mean ± SD.
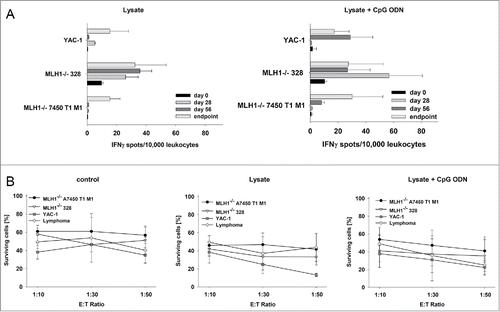
Figure 7. Functional immunological analysis. (A) IFNγ−ELISpot and (B) Flow cytometric cytotoxicity assay. (A) Reactivity of PBL (during vaccination) or splenocytes (endpoint) against target cells (MLH1−/− 7450 T1 M1, MLH1−/− 328, and YAC-1) was examined after overnight co-incubation. Lymphocytes were isolated from lysate-treated and control mice at different time points. These experiments identified increased reactivity post treatment. (B) Lytic activity of splenocytes against target cells (MLH1−/− 7450 T1 M1, MLH1−/− 328, and YAC-1) was examined after 12h co-incubation. Lymphocytes were isolated from spleens of lysate-treated and control mice. Again, an increased lytic activity upon vaccination was seen. Values are given as mean ± SD.
Supplemental material

Reprints and Corporate Permissions

Please note: Selecting permissions does not provide access to the full text of the article, please see our help page How do I view content?

To request a reprint or corporate permissions for this article, please click on the relevant link below:

Academic Permissions

Please note: Selecting permissions does not provide access to the full text of the article, please see our help page How do I view content?

Obtain permissions instantly via Rightslink by clicking on the button below:

If you are unable to obtain permissions via Rightslink, please complete and submit this Permissions form. For more information, please visit our Permissions help page.