1,830
Views
2
CrossRef citations to date
0
Altmetric
Original Research

Melanoma induced immunosuppression is mediated by hematopoietic dysregulation

, , , , , , , & show all
Article: e1408750 | Received 24 Oct 2017, Accepted 17 Nov 2017, Published online: 14 Dec 2017

Figures & data

Figure 1. Melanoma growth induces immune cell dysregulation, anemia and thrombocytopenia: (A) C57 BL/6 mice were subcutaneously injected with 2 × 10⁵ B16-F10 melanoma cells. Mice were euthanized at 21 days post tumor implantation (D21) and blood, spleen and BM was analyzed. No tumor (NT) mice were used as controls. Blood cells analyzed are shown. (B, C and D) White blood cell (WBC) counts, Hemoglobin (HB), hematocrit (HCT), RBC and platelet counts in peripheral blood are shown. Last graph in (C) shows percentage of B cells, CD4 and CD8 T lymphocytes in the blood as analyzed by flow. Data was analyzed by Student's t-test. Mean ± SD are shown. *p < 0.05, ***p < 0.005, ****p < 0.001.
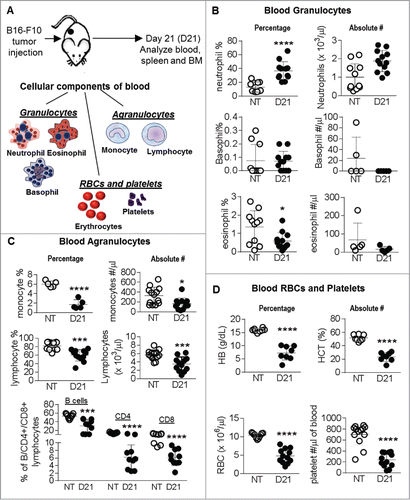
Figure 1. Melanoma growth induces immune cell dysregulation, anemia and thrombocytopenia: (A) C57 BL/6 mice were subcutaneously injected with 2 × 10⁵ B16-F10 melanoma cells. Mice were euthanized at 21 days post tumor implantation (D21) and blood, spleen and BM was analyzed. No tumor (NT) mice were used as controls. Blood cells analyzed are shown. (B, C and D) White blood cell (WBC) counts, Hemoglobin (HB), hematocrit (HCT), RBC and platelet counts in peripheral blood are shown. Last graph in (C) shows percentage of B cells, CD4 and CD8 T lymphocytes in the blood as analyzed by flow. Data was analyzed by Student's t-test. Mean ± SD are shown. *p < 0.05, ***p < 0.005, ****p < 0.001.

Figure 2. Melanoma growth alters RBC generation in the spleen and bone marrow: (A) Schematic showing erythropoiesis. (B) % and absolute number of reticulocytes in the blood of no tumor (NT) and B16-F10 tumor bearing mice at day 21 (D21). (C and D) RBC lineages in the spleens (C) and bone marrow (D) of NT and D21 mice was analyzed by flow cytometry using the markers CD71 and Ter119. Data was analyzed by Student's t-test. Mean ± SD are shown. *p < 0.05, **p < 0.01, ***p < 0.005.
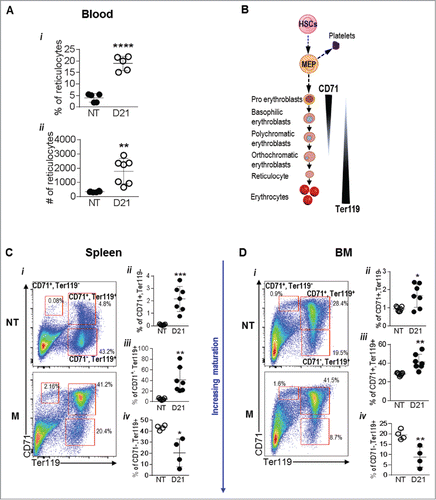
Figure 2. Melanoma growth alters RBC generation in the spleen and bone marrow: (A) Schematic showing erythropoiesis. (B) % and absolute number of reticulocytes in the blood of no tumor (NT) and B16-F10 tumor bearing mice at day 21 (D21). (C and D) RBC lineages in the spleens (C) and bone marrow (D) of NT and D21 mice was analyzed by flow cytometry using the markers CD71 and Ter119. Data was analyzed by Student's t-test. Mean ± SD are shown. *p < 0.05, **p < 0.01, ***p < 0.005.

Figure 3. Spleens from melanoma bearing mice show features of extramedullary hematopoiesis: (Ai) Image showing splenomegaly in B16-F10 melanoma bearing mice compared to NT mice. (ii) Spleen weights and (iii) total cell # post RBC lysis are also indicated. (B) Representative images showing HE stains of paraffin embedded spleen sections from NT and melanoma mice. (C) Percentage of (i) CD45+ hematopoietic cells and (ii) plasma cells (CD138+, CD19+) in NT and B16-F10 melanoma spleens were analyzed by flow cytometry. (Di) Total number of bone marrow cells from NT and B16-F10 melanoma mice (2 femur and 2 tibia) and (ii) % of CD45+ hematopoietic cells in the bone marrow post RBC lysis as analyzed by flow cytometry. (E) Representative images showing HE stains of paraffin embedded bone sections from WT and melanoma bearing mice. (F) Schematic showing hematopoiesis and generation of mature cells. Data was analyzed by Student's t-test. Mean ± SD are shown. **p < 0.01, ***p < 0.005, ****p < 0.001.
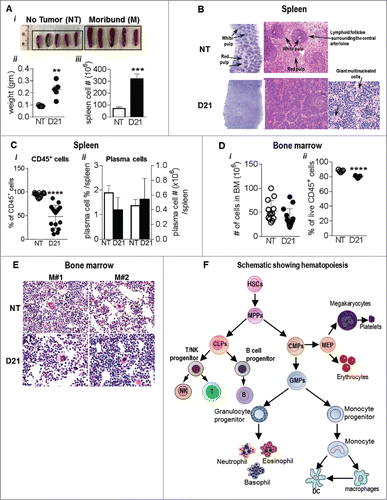
Figure 3. Spleens from melanoma bearing mice show features of extramedullary hematopoiesis: (Ai) Image showing splenomegaly in B16-F10 melanoma bearing mice compared to NT mice. (ii) Spleen weights and (iii) total cell # post RBC lysis are also indicated. (B) Representative images showing HE stains of paraffin embedded spleen sections from NT and melanoma mice. (C) Percentage of (i) CD45+ hematopoietic cells and (ii) plasma cells (CD138+, CD19+) in NT and B16-F10 melanoma spleens were analyzed by flow cytometry. (Di) Total number of bone marrow cells from NT and B16-F10 melanoma mice (2 femur and 2 tibia) and (ii) % of CD45+ hematopoietic cells in the bone marrow post RBC lysis as analyzed by flow cytometry. (E) Representative images showing HE stains of paraffin embedded bone sections from WT and melanoma bearing mice. (F) Schematic showing hematopoiesis and generation of mature cells. Data was analyzed by Student's t-test. Mean ± SD are shown. **p < 0.01, ***p < 0.005, ****p < 0.001.

Figure 4. Extramedullary hematopoiesis in spleen results in increased stem and progenitor cells: (A) spleens of NT and melanoma mice 21 days post tumor implantation (D21) were analyzed by flow cytometry. (i) Dot plots show gating strategy. (ii-iii) Lin- cells were identified using the lineage antibody cocktail. (iv-v) Within the Lin- cells, the LSK and progenitor cell population was gated as c-kit+, sca-1+ cells. (vi-vii) Myeloid progenitors (MPs) were gated as c-kit+, sca-1− cells. (Bi) Dot plot showing gating of oligopotent myeloid progenitors. (ii-iii) Common myeloid progenitors (CMPs), iv-v) granulocyte-monocyte precursors (GMPs) and (vi-vii) megakaryocyte-erythroid progenitors (MEPs) were gated as CD34+, FcgRII/IIIlow cells, CD34+, FcgRII/IIIhigh and CD34, FcgRII/IIIlow cells respectively within the MPs. (Ci-iii) Common lymphoid progenitors (CLPs) were identified as IL-7Rα+ Sca-1+ cells within the Lin, c-kitlow population. Absolute cell numbers in all panels were obtained by multiplying the frequency of each population by the number of live cells in the spleen. Data was analyzed by Student's t-test. Mean ± SD are shown. *p < 0.05, **p < 0.01, ***p < 0.005, ns is not significant.
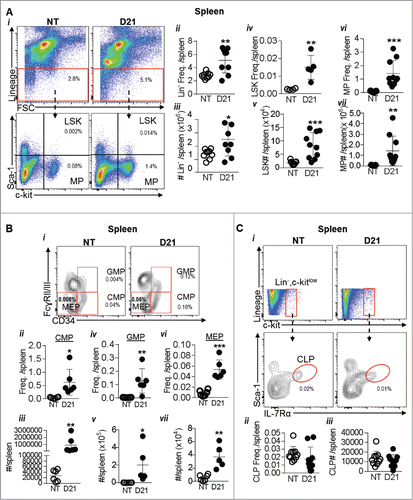
Figure 4. Extramedullary hematopoiesis in spleen results in increased stem and progenitor cells: (A) spleens of NT and melanoma mice 21 days post tumor implantation (D21) were analyzed by flow cytometry. (i) Dot plots show gating strategy. (ii-iii) Lin- cells were identified using the lineage antibody cocktail. (iv-v) Within the Lin- cells, the LSK and progenitor cell population was gated as c-kit+, sca-1+ cells. (vi-vii) Myeloid progenitors (MPs) were gated as c-kit+, sca-1− cells. (Bi) Dot plot showing gating of oligopotent myeloid progenitors. (ii-iii) Common myeloid progenitors (CMPs), iv-v) granulocyte-monocyte precursors (GMPs) and (vi-vii) megakaryocyte-erythroid progenitors (MEPs) were gated as CD34+, FcgRII/IIIlow cells, CD34+, FcgRII/IIIhigh and CD34−, FcgRII/IIIlow cells respectively within the MPs. (Ci-iii) Common lymphoid progenitors (CLPs) were identified as IL-7Rα+ Sca-1+ cells within the Lin−, c-kitlow population. Absolute cell numbers in all panels were obtained by multiplying the frequency of each population by the number of live cells in the spleen. Data was analyzed by Student's t-test. Mean ± SD are shown. *p < 0.05, **p < 0.01, ***p < 0.005, ns is not significant.

Figure 5. Melanoma growth blocks B cell development at the Pro B cell stage: (A) Schematic showing B cell development from the level of CLPs. (Bi) Various stages of B cell generation in the BM were identified using CD24 and BP-1 (Ly51) marker within the B220+, IgM- cells in the BM. Cells were gated as PrePro B cells (CD24-, BP-1+), Pro B cells (CD24+, BP-1-) and Pre B cells (CD24+, BP-1+). Immature B cells were gated as B220+, IgM+ and IgD- cells. (ii-v) Proportions of PrePro B cells, Pro B cells, Pre B cells and immature B cells in the BM of NT and B16-F10 melanoma bearing mice 21 days post tumor implantation (D21) are shown. Data was analyzed by Student's t-test. Mean ± SD are shown. ****p < 0.001.
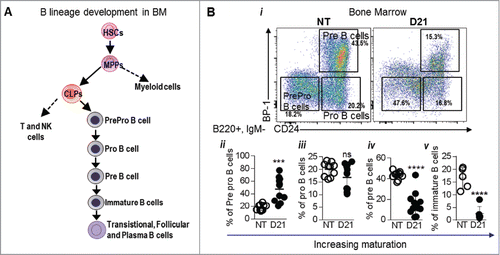
Figure 5. Melanoma growth blocks B cell development at the Pro B cell stage: (A) Schematic showing B cell development from the level of CLPs. (Bi) Various stages of B cell generation in the BM were identified using CD24 and BP-1 (Ly51) marker within the B220+, IgM- cells in the BM. Cells were gated as PrePro B cells (CD24-, BP-1+), Pro B cells (CD24+, BP-1-) and Pre B cells (CD24+, BP-1+). Immature B cells were gated as B220+, IgM+ and IgD- cells. (ii-v) Proportions of PrePro B cells, Pro B cells, Pre B cells and immature B cells in the BM of NT and B16-F10 melanoma bearing mice 21 days post tumor implantation (D21) are shown. Data was analyzed by Student's t-test. Mean ± SD are shown. ****p < 0.001.

Figure 6. IL-3 skews hematopoiesis towards myeloid lineage: (A) Bone marrow cells from wild type mice were cultured with B16-F10 cells' culture supernatant (CM) for 3 days after which the cells were analyzed by flow cytometry for (i) MDSCs, (ii) F4/80+ and (iii) Gr-1+ cells. (B) Cultures were also analyzed for (i) Lin- and (ii) LSK cells. (C) Cytokine array analysis was performed on culture supernatant from B16-F10 CM or plain media (Ctrl). Bar graphs show the pixel intensity of each spot. Red boxes indicate the cytokines that were highly expressed in B16-F10-CM. (Di-vi) BM cells were cultured with RPMI media supplemented with recombinant C5 a (20 ng/ml), IL-3 (50 ng/ml), IL-1Rα (20 ng/ml) or a combination of all 3 cytokines for 3 days. Cultures were then analyzed by flow cytometry for stem and progenitor cells. Data was analyzed by Student's t-test. Mean ± SD are shown. *p < 0.05, **p < 0.01, ***p < 0.005, ****p < 0.001.
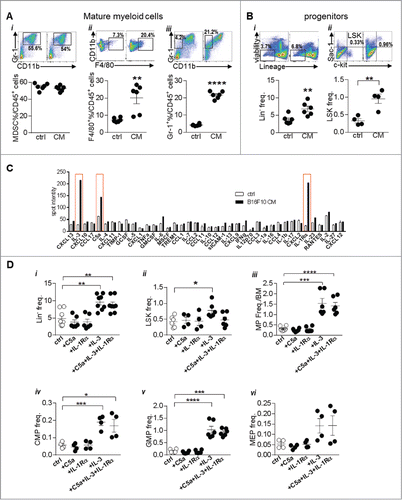
Figure 6. IL-3 skews hematopoiesis towards myeloid lineage: (A) Bone marrow cells from wild type mice were cultured with B16-F10 cells' culture supernatant (CM) for 3 days after which the cells were analyzed by flow cytometry for (i) MDSCs, (ii) F4/80+ and (iii) Gr-1+ cells. (B) Cultures were also analyzed for (i) Lin- and (ii) LSK cells. (C) Cytokine array analysis was performed on culture supernatant from B16-F10 CM or plain media (Ctrl). Bar graphs show the pixel intensity of each spot. Red boxes indicate the cytokines that were highly expressed in B16-F10-CM. (Di-vi) BM cells were cultured with RPMI media supplemented with recombinant C5 a (20 ng/ml), IL-3 (50 ng/ml), IL-1Rα (20 ng/ml) or a combination of all 3 cytokines for 3 days. Cultures were then analyzed by flow cytometry for stem and progenitor cells. Data was analyzed by Student's t-test. Mean ± SD are shown. *p < 0.05, **p < 0.01, ***p < 0.005, ****p < 0.001.

Figure 7. IL-3 antibody administration enhances B16-F10 melanoma induced hematopoiesis towards myeloid lineages: (A) Schematic showing experimental design to test the role of IL-3. (Bi-xiv) Effect of isotype control (iso) or IL-3 antibody (IL-3 Ab) administration on hematopoietic stem and progenitor cell populations from B16-F10 melanoma mice are shown. (Ci-ii) Effect on committed B cell progenitors is shown. Data was analyzed by Student's t-test. Mean ± SD are shown. *p < 0.05, **p < 0.01, ns is not significant.
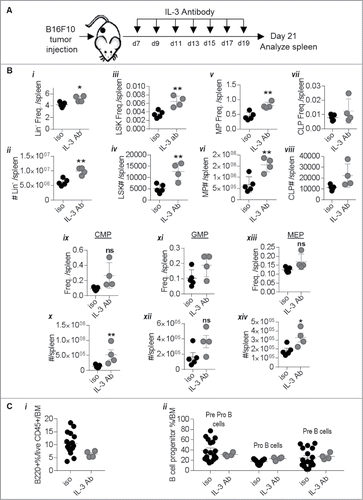
Figure 7. IL-3 antibody administration enhances B16-F10 melanoma induced hematopoiesis towards myeloid lineages: (A) Schematic showing experimental design to test the role of IL-3. (Bi-xiv) Effect of isotype control (iso) or IL-3 antibody (IL-3 Ab) administration on hematopoietic stem and progenitor cell populations from B16-F10 melanoma mice are shown. (Ci-ii) Effect on committed B cell progenitors is shown. Data was analyzed by Student's t-test. Mean ± SD are shown. *p < 0.05, **p < 0.01, ns is not significant.
Supplemental material

supp_data_1408750.pptx

Download MS Power Point (2.1 MB)

Reprints and Corporate Permissions

Please note: Selecting permissions does not provide access to the full text of the article, please see our help page How do I view content?

To request a reprint or corporate permissions for this article, please click on the relevant link below:

Academic Permissions

Please note: Selecting permissions does not provide access to the full text of the article, please see our help page How do I view content?

Obtain permissions instantly via Rightslink by clicking on the button below:

If you are unable to obtain permissions via Rightslink, please complete and submit this Permissions form. For more information, please visit our Permissions help page.