1,181
Views
8
CrossRef citations to date
0
Altmetric
Brief Report

High β-1,4-Galactosyltransferase-I expression in peripheral T-lymphocytes is associated with a low risk of relapse in germ-cell cancer patients receiving high-dose chemotherapy with autologous stem cell reinfusion

, , , , , , , , , , & show all
Article: e1423169 | Received 20 Sep 2017, Accepted 22 Dec 2017, Published online: 16 Feb 2018

Figures & data

Figure 1. Gating strategy applied for cell sorting with further RT-PCR analysis of B4GALT1 and IL10 expression levels in compartments of MNC from leukapheresis products. (A) Forward scatter versus side scatter gating for exclusion of debris. (B) CD14 versus vital stain gating for the exclusion of dead cells (grey gate). CD14 versus CD3 plotting in order to identify CD3-positive T-cells (upper left black gate) and CD14-positive monocytes (lower right black gate). (C) B4GALT1 levels in peripheral blood T-lymphocytes are significantly higher in patients with no relapse compared to those patients with relapse (Mann-Whitney-test, p = 0.008). Neither B4GALT1 levels in (D) monocytes (p = 0.251), and (E) unsorted MNC samples (p = 0.650), nor (F) IL10 expression levels in T-cells (p = 0.178) are significantly different upon Mann-Whitney-testing. Plots show mean and standard deviation, respectively. FSC: forward scatter; MNC: mononuclear cells; ns: not significant; SSC: side scatter.
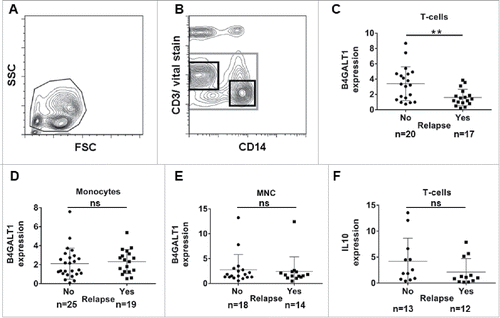
Figure 1. Gating strategy applied for cell sorting with further RT-PCR analysis of B4GALT1 and IL10 expression levels in compartments of MNC from leukapheresis products. (A) Forward scatter versus side scatter gating for exclusion of debris. (B) CD14 versus vital stain gating for the exclusion of dead cells (grey gate). CD14 versus CD3 plotting in order to identify CD3-positive T-cells (upper left black gate) and CD14-positive monocytes (lower right black gate). (C) B4GALT1 levels in peripheral blood T-lymphocytes are significantly higher in patients with no relapse compared to those patients with relapse (Mann-Whitney-test, p = 0.008). Neither B4GALT1 levels in (D) monocytes (p = 0.251), and (E) unsorted MNC samples (p = 0.650), nor (F) IL10 expression levels in T-cells (p = 0.178) are significantly different upon Mann-Whitney-testing. Plots show mean and standard deviation, respectively. FSC: forward scatter; MNC: mononuclear cells; ns: not significant; SSC: side scatter.

Table 1. Difference in relapse-free survival was calculated with the Cox regression model.

Table 2. Patients' characteristics.

Figure 2. Relapse-free survival rates in 46 relapsed germ cell cancer patients with respect to the number of HDCT and ASCR, the international prognostic factor score, B4GALT1 and IL10 expression levels. (A) RFS is not significantly different in patients with one (black line), two (grey line) or three (dotted line) SCT cycles (log-rank test, p = 0.055). (B) Analysis of patients’ RFS according to the IPFSG categories. Patients with a good prognosis score (i.e. 0; black line) were compared to those with an intermediate (i.e. 1; grey line) and poor prognosis score (i.e. 2–3 and 2nd relapse; dotted line). RFS is not significantly different between these groups (log-rank test, p = 0.420). (C) RFS is significantly higher in patients with high T-cell B4GALT1 mRNA expression levels (grey line) compared to those with low levels (black line) (log-rank test, p = 0.044). High and low refer to values above and below the median value, respectively. (D) RFS is significantly higher in patients with high IL10 mRNA expression levels (grey line) compared to those with low levels (black line) (log-rank test, p = 0.015). IPFSG: International Prognostic Factor Study Group; RFS: relapse-free survival; SCT: stem cell transplantation.
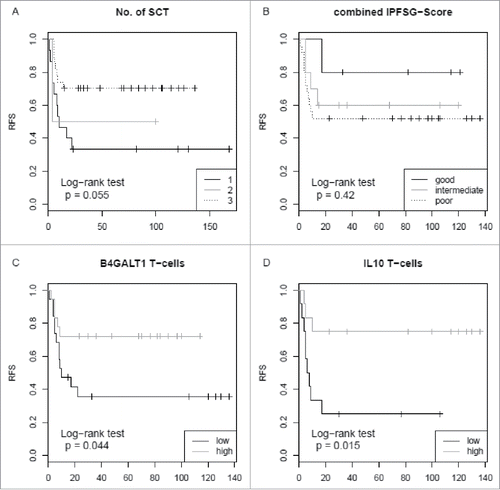
Figure 2. Relapse-free survival rates in 46 relapsed germ cell cancer patients with respect to the number of HDCT and ASCR, the international prognostic factor score, B4GALT1 and IL10 expression levels. (A) RFS is not significantly different in patients with one (black line), two (grey line) or three (dotted line) SCT cycles (log-rank test, p = 0.055). (B) Analysis of patients’ RFS according to the IPFSG categories. Patients with a good prognosis score (i.e. 0; black line) were compared to those with an intermediate (i.e. 1; grey line) and poor prognosis score (i.e. 2–3 and 2nd relapse; dotted line). RFS is not significantly different between these groups (log-rank test, p = 0.420). (C) RFS is significantly higher in patients with high T-cell B4GALT1 mRNA expression levels (grey line) compared to those with low levels (black line) (log-rank test, p = 0.044). High and low refer to values above and below the median value, respectively. (D) RFS is significantly higher in patients with high IL10 mRNA expression levels (grey line) compared to those with low levels (black line) (log-rank test, p = 0.015). IPFSG: International Prognostic Factor Study Group; RFS: relapse-free survival; SCT: stem cell transplantation.
Supplemental material