Figures & data
Figure 1. Distribution of NK cell subsets in the blood of NSCLC patients.
Representative flow cytometry gating strategy and proportion of circulating (A) total CD3− CD56+ NK cells among PBMCs in HD (n = 41) and NSCLC patients (n = 176); and (C) CD56dim CD16+, (D) CD56dim CD16− and (E) CD56bright CD16− NK cell subsets among total NK cells in HD (n = 41) and NSCLC patients (n = 176). (B) Frequency of each NK cell subsets in blood of HD (n = 41) and NSCLC patients (n = 176) represented by stacked bars. (F) Proportion of total NK cells among PBMCs and proportions of CD56dim CD16+, CD56dim CD16− and CD56bright CD16− NK cell subsets among total NK cells in NSCLC patients according to the disease stage. Statistical analysis were performed using the Mann-Whitney test (two groups) or the Kruskal-Wallis test (more than two groups) (ns = not significant; ** P < 0.01; *** P < 0.001).
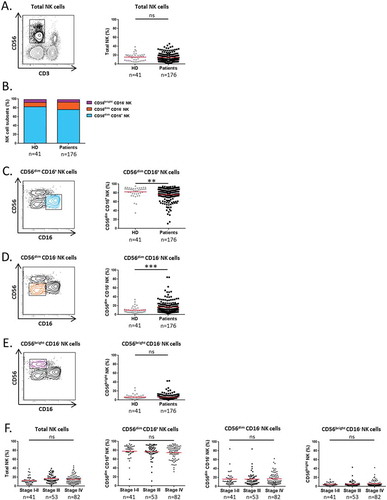
Figure 2. Blood NK cell cytotoxicity in NSCLC patients.
PBMCs from patients and HD were cultured with K562 cells for 6 hours at a ratio E:T of 1:1. (A) Degranulation of total NK cells among PBMCs was assessed by flow cytometry: percentages of total NK cells expressing CD107a (right panel) and Granzyme B (left panel) in HD (n = 10) and NSCLC patients (n = 10), Mann-Whitney test (ns = not significant; ** P < 0.01). Spontaneous (open circles) and K562-activated (solid circles) values are indicated, paired t-test (* P < 0.05; ** P < 0.01; **** P < 0.0001). (B) Percentages of K562 cell death represented by rates of annexin V+ 7-AAD+ and annexin V+ 7-AAD− K562 cells, after 6 hours of interactions with PBMCs from HD (n = 10) and NSCLC patients (n = 10), Mann-Whitney test (ns = not significant). Columns, mean of rates; bars, SEM. On the left panels, (C) degranulation and (D) Granzyme B production by NK cell subsets in response to K562 stimulation of a representative patient are showed. The percentages indicate the rate of CD107a+ and Granzyme B+ NK cells after gating on CD56dim CD16+, CD56dim CD16− or CD56bright cells. On the right panels, are summarized rates of (C) CD107a+ and (D) Granzyme B+ among CD56dim CD16+, CD56dim CD16− and CD56bright NK cell subsets of either both HD (grey n = 10) and patients (black n = 10), Mann-Whitney test (ns = not significant; * P < 0.05; *** P < 0.001; **** P < 0.0001), or only patients (black n = 10), Friedman test (ns = not significant; * P < 0.05; *** P < 0.001; **** P < 0.0001). Red bars represent the mean of each group.
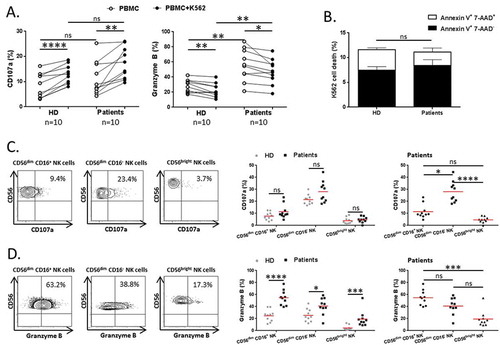
Figure 3. Regulatory function of NK cells in NSCLC patients.
PBMCs from patients and HD were activated with K562 cells for 6 hours at a ratio E:T of 1:1. (A) Cytokines production of total NK cells among PBMCs was assessed by flow cytometry: percentages of total NK cells producing IFN-γ (left panel) and TNF-α (right panel) in HD (n = 10) and NSCLC patients (n = 10), Mann-Whitney test (ns = not significant). Spontaneous (open circles) and K562-activated (solid circles) values are indicated, paired t-test (** P < 0.01). On the left panels, (B) IFN-γ and (C) TNF-α production by NK cell subsets in response to K562 stimulation of a representative patient are showed. The percentages indicate rates of IFN-γ+ and TNF-α+ NK cells after gating on CD56dim CD16+, CD56dim CD16− or CD56bright cells. On the right panels, are summarized rates of (B) IFN-γ+ and (C) TNF-α+ among CD56dim CD16+, CD56dim CD16− and CD56bright NK cell subsets of either both HD (grey n = 10) and patients (black n = 10), Mann-Whitney test (ns = not significant), or only patients (black n = 10), Friedman test (ns = not significant; * P < 0.05; *** P < 0.001) Red bars represent the mean of each group. (D) PBMCs from patients were activated with IL-2, (1000U/mL), IL-12 (10ng/mL) or IL-21 (50ng/mL) for 20 hours. Proportions of IFN-γ+ and TNF-α+ among total, CD56dim CD16+, CD56dim CD16− and CD56bright NK cell subsets in NSCLC patients (n = 10), Friedman test (ns = not significant; * P < 0.05; ** P < 0.01; *** P < 0.001). Red bars represent the mean of each group.
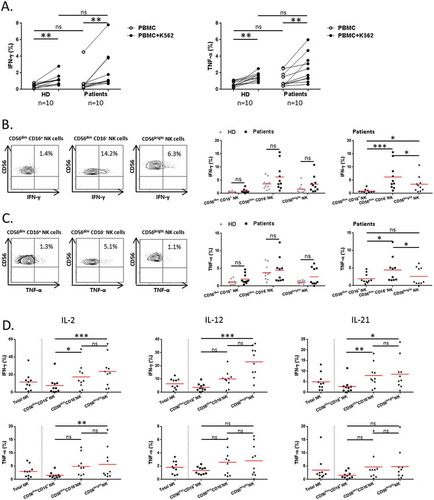
Figure 4. Analysis of activating receptors on NK cell subsets in NSCLC patients.
Proportions of (A) NKG2D+, (B) NKp30+, (C) NKp44+ and (D) NKp46+ among total, CD56dim CD16+, CD56dim CD16− and CD56bright NK cell subsets in HD (grey n = 41) and NSCLC patients (black n = 176). Red bars represent the mean of each group. Statistical analysis were performed using the Mann-Whitney test (ns = not significant; * P < 0.05; ** P < 0.01; *** P < 0.001; **** P < 0.0001).
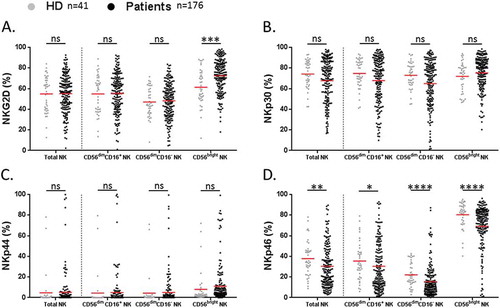
Figure 5. Hierarchical clustering of NK cell activating receptors.
Hierarchical clustering of (A) NSCLC patients (n = 176) and (B) HD (n = 41) was realized according to NKp44, NKp30, NKG2D and NKp46 expression on NK cell subsets. The percentage values obtained for the were used and the clustering was performed using Morpheus Software.
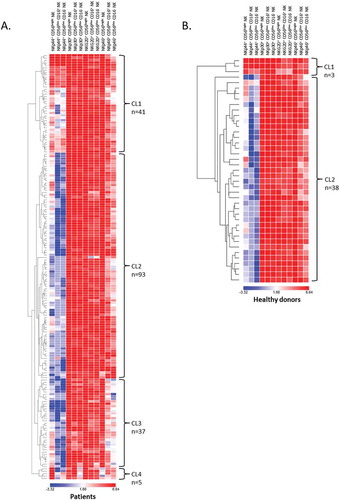
Figure 6. Patients’ survival according to the rate of NK cell subsets expressing NKp46.
Survival of patients is depicted as Kaplan-Meier curves. Patients (n = 165) were divided into two groups low and high as detailed in result section, graphically defined by a cut off value of 37% for (A) NKp46+ NK cells and (B) NKp46+ CD56dim CD16+ NK cells; and defined by the percentage mean value of: (C) NKp46+ CD56bright NK cells (mean = 59%) and (D) NKp46+ CD56dim CD16− NK cells (mean = 29%). Statistical analysis was performed using the Log-Rank test.
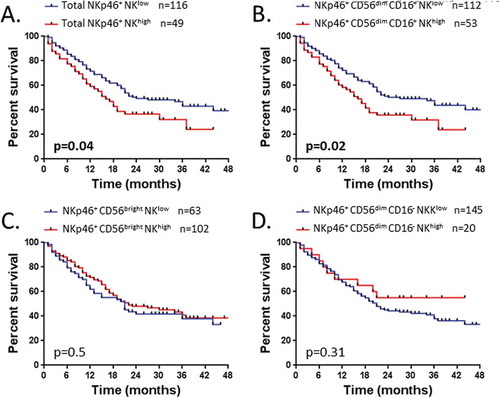
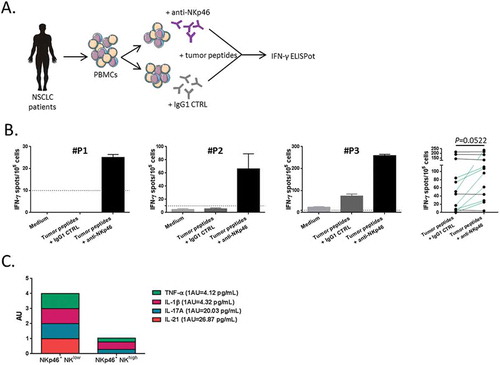
Figure 7. Blockade of NKp46 restored tumor-specific T cell response.
(A) Blood lymphocytes from NSCLC patients were stimulated with tumor-derived peptides in presence or not of blocking antibodies (mAb) against NKp46. (B) Three representative examples and the whole of number of IFN-γ-producing antitumor Th1 cells measured by ELISpot assay with IgG1 isotype control or anti-NKp46 mAb are showed in NSCLC patients (n = 11), paired t-test. Columns, mean of spots from triplicate wells; bars, SEM. (D) Cumulative representation of normalized (arbitrary unit) cytokines concentrations (TNF-α, IL-1β, IL-17A and IL-21) in serum of patients with low or high rate of NKp46+ CD56dim CD16+ NK cells.