Figures & data
Figure 1. MBL deficiency promotes tumor growth in a murine HCC model.
WT (n = 10) and MBL–/– mice (n = 10) received a tail vein intravenously injection of 2 × 10⁶ Hepal-6 cells. After 3 weeks, mice were sacrificed and the visible liver tumor nodules, maximal tumor size (a) and liver index (b) were examined. Scale bars, 1 cm. (c) Analysis of Ki67 positive cells in tumor tissues by immunohistochemistry (each dot represents the average of 10 HPFs). Scale bars, 50 μm. Data are presented as means ± SEM (horizontal lines). HPFs, high-power fields; *, P < 0.05; **, P < 0.01.
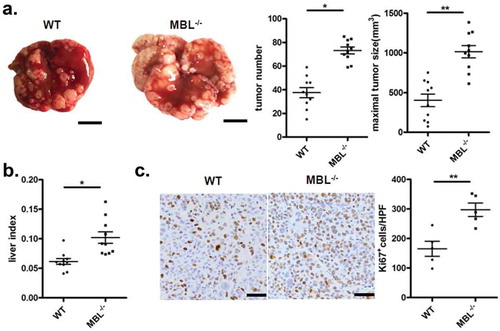
Figure 2. MBL does not directly affect tumor cell biology.
(a) MBL expression in mouse liver tissue, Hepal-6 cells and HepG2 cells was detected by immunoblotting analyses. (b) mRNA expression of MBL in Hepal-6 cells was determined by RT-PCR. (c) Representative images of immunohistochemistry staining of MBL in tumor tissues from mice bearing HCC or HCC patients. Scale bars, 50 μm. HepG2 cells were cultured with 0 µg/ml (blank bar), 5 µg/ml (grey bar) and 20µg/ml (black bar) MBL and then the cell proliferation (d) and apoptosis (e) was analyzed by CCK8 assay and flow cytometry, respectively. The percentages represent the frequency of the cells undergoing early apoptosis (Annexin-V+7-AAD−) or late apoptosis (Annexin-V+7-AAD+). Data from at least three independent experiments are presented as mean± SEM.
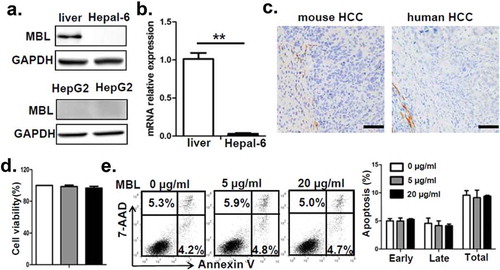
Figure 3. MBL deficiency causes elevation of MDSCs in tumor tissue.
Representative plots (left panel) and statistical analysis (right panel) of (a) MDSCs (CD11b+Gr-1+), (b) G-MDSCs (CD11b+Ly6ClowLy6G+) and M-MDSCs (CD11b+Ly6ChighLy6G−) frequency in tumor tissue of WT or MBL–/– mice were analyzed by flow cytometry. (c) Analysis of Gr-1 positive MDSCs in tumor tissues by immunohistochemistry (each dot represents the average of 10 HPFs). Scale bars, 50 μm. The percentages represent the cell frequency in CD45+ cells. The percentages of (d) IFN-γ+CD8+ cells gated on CD3+CD8+ T cells and (e) Tregs (CD25+Foxp3+ cells) frequency gated on CD4+ cell in tumor tissues of tumor-bearing mice were analyzed by flow cytometry. (f) Representative histogram showed immue-checkpoint molecule PD-L1 expression on MDSCs and PD-1 expression on CD3+CD8+ T cells and Tregs in tumor tissue of WT or MBL–/– mice. The numerical values represent the mean fluorescence intensity (MFI, WT/MBL–/–). Data are presented as means ± SEM (horizontal lines). *, P < 0.05; **, P < 0.01. The data representative of three independent experiments with similar results are shown.
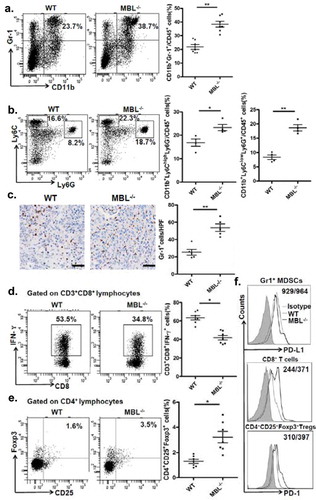
Figure 4. MBL deficiency is associated with an increase of activated HSCs.
(a) Analysis of activated HSCs (α-SMA+ immunoreactive area, IRA) in tumor tissue of tumor-bearing WT and MBL–/– mice. Scale bars, 50 μm. α-SMA (b) and its mRNA expression (c) in liver tissue were analyzed by immunoblot assay and RT-PCR, respectively. (d) Immunofluorescence analysis of co-localization of MBL (green) andα-SMA (red) in situ in tumor tissues of WT mice and HCC patients. Scale bars, 25 μm. Quiescent HSCs (qHSCs) were separated from the normal WT mouse liver as described in Materials and Methods. Activated HSCs (aHSCs) were obtained by culture qHSCs with Hepal-6-CM. MBL (e) and its mRNA expression (f) in qHSCs and aHSCs were analyzed by immunoblotting and quantitative RT-PCR, respectively. Hepatocytes served as a positive control. The data representative of more than three independent experiments with similar results are shown.
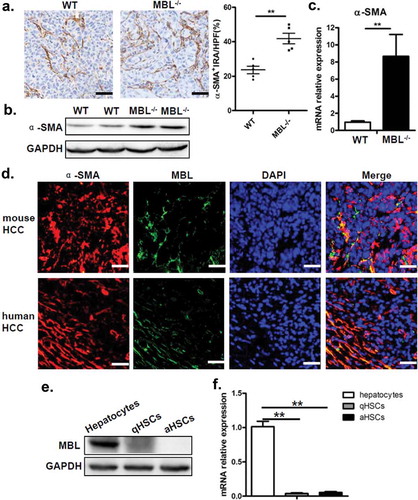
Figure 5. MBL deficiency correlates with elevated COX-2 expression and PGE2 production.
(a) The liver homogenate was collected to detect the PGE2 production by ELISA. COX-2 protein (b) and its mRNA expression (c) in tumor tissues were analyzed by immunoblotting and quantitative RT-PCR, respectively. (d) Analysis of COX-2 positive cells in tumor tissues by immunohistochemistry (each dot represents the average of 10 HPFs). (e) Immunofluorescence double staining of COX-2 (green) and α-SMA+ cells (red) and (f) quantification of α-SMA+ cells with COX-2 overexpression (white arrow) in tumor tissues of tumor-bearing mice. Nuclei were counterstained with DAPI (blue). Scale bars, 25 μm. Each dot represents the average percentages of cells indicated by arrow on 10 HPFs. Data are presented as means ± SEM (horizontal lines). *, P < 0.05; **, P < 0.01. The data representative of more than three independent experiments with similar results are shown.
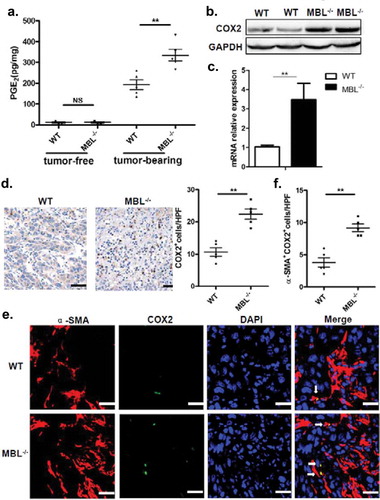
Figure 6. COX-2 inhibition abrogates the MBL deficiency-promoted tumor growth and MDSC accumulation.
Mice received daily intraperitoneal injections of either selective COX-2 inhibitor SC-236 or vehicle (DMSO) throughout 21 days of HCC model establishment. Mice were then sacrificed. The liver tumor nodules and maximal tumor size (a) as well as liver index (b) were examined. Scale bars, 1 cm. Representative plots and statistical analysis of (c) MDSCs (Gr-1+CD11b+), (d) G-MDSCs (CD11b+Ly6ClowLy6G+) and M-MDSCs (CD11b+Ly6ChighLy6G−) frequency in CD45+ cells in tumor tissue of the two mice groups. The percentages of (e) IFN-γ+CD8+ cells gated on CD8+ T cells and (f) Tregs (CD25+Foxp3+ cells) frequency gated on CD4+ T cell in tumor tissues of tumor-bearing mice were analyzed by flow cytometry. Data are presented as means ± SEM (horizontal lines). NS, not significant. *, P < 0.05; **, P < 0.01. The data representative of at least three independent experiments with similar results are shown.
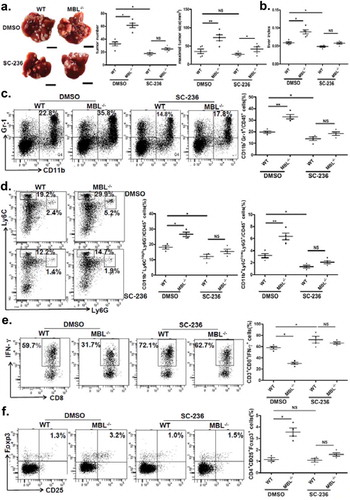
Figure 7. MBL regulates the ERK-mediated alteration of COX-2/PGE2 in the HSCs.
(a) Analysis of MBL expression in LX-2 cells by immunoblotting. (b) LX2 cells were incubated with biotin-labeled MBL or not, then stained with avidin-FITC. The levels of cell-bound MBL were determined by flow cytometry. LX-2 cells were cultured with HepG2-CM and/or MBL for 24h, subsequently the α-SMA, COX2, P38, ERK1/2, phosphor-P38 and phosphor-ERK1/2 levels were measured by immunoblotting (c); α-SMA and COX2 mRNA expression in these cells were confirmed by RT-PCR (d). α-SMA, COX2, ERK1/2 and phosphor-ERK1/2 levels in HepG2-CM activated LX-2 cells cultured with MBL and pretreated with U0126, an inhibitor of phosphorylation of ERK, were assayed by immunoblotting analysis (e). (f) PGE2 production in the culture supernatant was determined by ELISA. For all immunoblotting assays, GAPDH was included as the internal loading control. Data are presented as means ± SEM (horizontal lines). NS, not significant. *, P < 0.05; **, P < 0.01. The data representative of at least three independent experiments with similar results are shown.
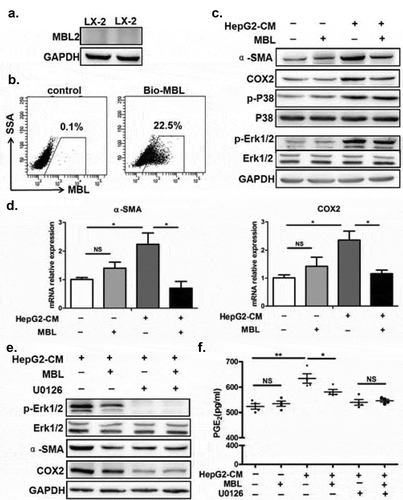
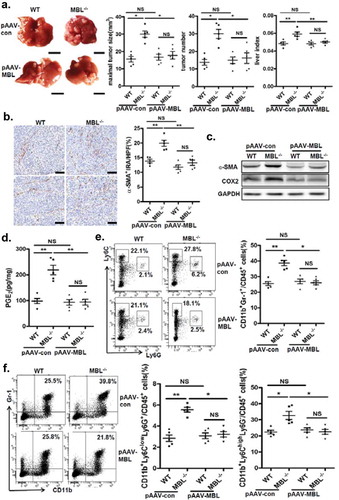
Figure 8. AAV-mediated restoration of hepatic MBL abrogated MBL deficiency-promoted tumor growth.
The following parameters were measured in liver tumor tissues of WT and MBL–/– mice in the murine HCC model established as described in . pAAV-con and pAAV-MBL vectors were administered 3 weeks before hepal-6 cell injection. (a) Liver tumor number, maximal tumor size and liver index were monitored. (b) The frequency of α-SMA+ activated HSCs in liver sections was evaluated by immunohistochemistry. (c) α-SMA and COX-2 protein expression and (d) PGE2 production in the liver were determined by immunoblotting and ELISA respectively. (e) MDSCs (Gr-1+CD11b+), (f) G-MDSCs (CD11b+Ly6ClowLy6G+) and M-MDSCs (CD11b+Ly6ChighLy6G−) frequency in liver tumor tissue. The percentages represent the cell frequency in CD45+ cells. Data are presented as means ± SEM (horizontal lines). NS, not significant. *, P < 0.05; **, P < 0.01. The data representative of at least three independent experiments with similar results are shown.