Figures & data
Figure 1. Characterization of eight parental TCRs recognizing HLA-A*0201 presenting the MAGE-A10254-262 peptide, using cellular and biochemical assays.
The response of eight of the ten parental TCRs to MAGE-A10+ and MAGE-A10− target cell lines is shown in the two left-hand panels, ordered from lowest (c740) to highest (c727) affinity. Blue points represent numbers of IFN-γ spot forming units (SFU) counted in triplicate wells for two T-cell donors, with TCR-transduced T-cells; gray points represent the responses of non-transduced T-cells (consistently < 20 SFU). The two right-hand panels illustrate the strength of interaction between the parental TCRs and the HLA-A*0201-restricted MAGE-A10 peptide GLYDGMEHL254-262, in both cell surface expression and soluble formats. EC50 values, indicating the sensitivity of TCR-engineered T-cells to antigen, were assessed by counting the numbers of T-cells releasing IFN-γ in response to T2 cells pulsed with a titration of GLYDGMEHL254-262 peptide (ELISpot assay). Points represent mean values of -log(EC50) ± SEM (error bars); control measurements were carried out in the absence of peptide. Affinities (KD values) were calculated using equilibrium analysis of SPR measurements made using a Biacore-3000TM system. Points represent mean values of KD−1 ± SEM (shown by error bars where replicate assays were performed).
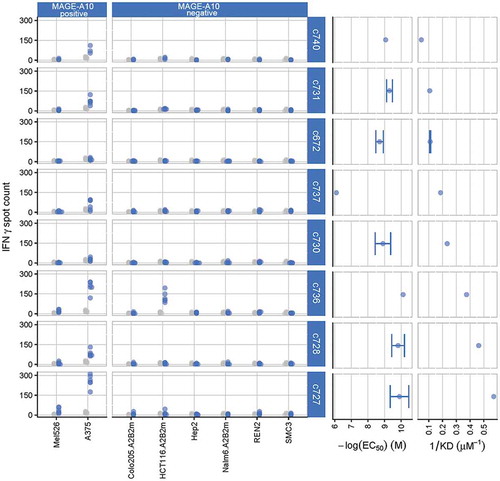
Figure 2. Biochemical characterization of affinity-enhanced TCR panels arising from the parental TCRs c672, c728 and c740.
Comparison of SPR data for affinity-enhanced TCR panels arising from three parental TCRs for which raw SPR data is shown in Figure S1. Note that TCR c753 is a version of c672 with the α-chain reverted fully to germline sequence, and that c753 therefore acted as the template for the daughter mutants c754-c756. Binding affinity analysis of the MAGE-A10254-262-specific mutant TCR panels is illustrated in the upper panel, which shows the binding curve fits. KD values shown in the bottom panel were obtained by equilibrium binding or kinetic analysis. From the c728 panel, c796-c799 were tested in a separate SPR experiment to c728 and c793-c795, leading to the difference in maximum binding levels.
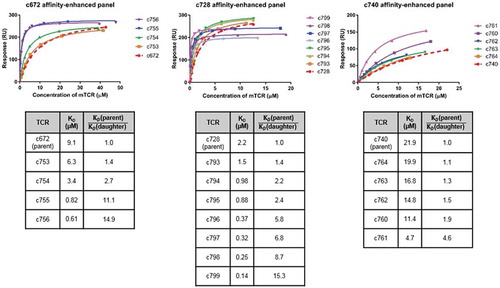
Figure 3. Characterization of three affinity-enhanced TCR panels arising from the c672, c740 and c728 parental TCRs, using cellular assays.
The response of each affinity-enhanced TCR panel to MAGE-A10+ and MAGE-A10− target cell lines is shown, with daughter TCRs sorted in order of increasing affinity (top to bottom) for each parent. MAGE-A10+ cell lines are shown in order of increasing MAGE-A10 expression (left to right), as assessed by RT-qPCR. Red points represent average numbers of IFN-γ spot forming units (SFU) for T-cells obtained from two donors and transduced with each parental TCR, each measured in triplicate. Blue points represent the responses of T-cells transduced with the daughter TCR, while grey points represent the responses of non-transduced cells (consistently < 50 SFU).
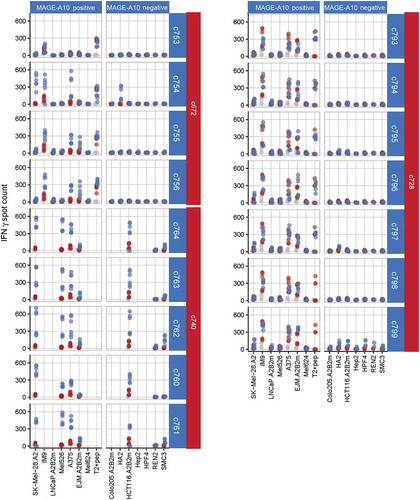
Figure 4. Extended specificity and functional cytotoxicity testing of final TCR candidates arising from the c672 and c728 parental TCRs.
(A) Extended tumor cell line and primary cell screen of five candidate TCRs selected on the basis of initial characterization (see ). Blue points represent numbers of IFN-γ spot forming units (SFU) counted in triplicate wells in two donors, for TCR-transduced T-cells; grey points represent the responses of non-transduced T-cells (consistently < 50 SFU). MAGE-A10− cell lines did not induce T-cell responses above the background level. (B) Potency testing of two final candidate TCRs c756 and c796 using a real-time cytotoxicity assay. Functional cytotoxicity was confirmed, and the magnitude and kinetics of the killing of MAGE-A10+ HLA-A*0201-transduced SK-Mel-28 cells were similar.
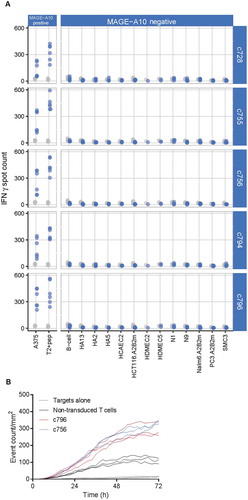
Figure 5. Peptide X-scan analysis to assess specificity of the c756 and c796 MAGE-A10-specific TCRs.
Number and diversity of amino acids tolerated at various peptide positions by the final candidate TCRs. This example shows search motifs for the 10% threshold (side chains in whose presence IFN-γ spot counts were at least 10% of that triggered by the index peptide).(A) Pie areas are proportional to the number of tolerated amino acids, including the index. Pie segments represent a breakdown of tolerated amino acids into groups with similar physico-chemical properties. Individual amino acids in group colors are listed in panel B, classification and color scheme are explained in the main text. The area within the outer circle corresponds to all 20 amino acids being tolerated at a 10% threshold; the color of the circle indicates the group of the index peptide. (B) Comparison of the X-scan search motifs for c756 and c796 at a response threshold of 10%. (C) Total number of tolerated residues at each peptide position, including the index. The number of residues that would be identified as potentially tolerated by an alanine scan is shown for comparison. The product of the numbers of recognized residues at each position is the motif size, or number of peptide sequences generated by all possible permutations of amino acids tolerated by a TCR.
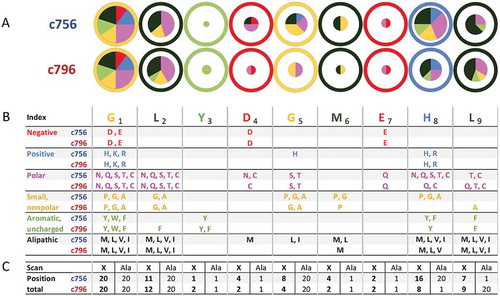
Figure 6. Further analysis of peptide X-scan data confirming the superior specificity of the c796 MAGE-A10-specific TCR over c756.
(A) An illustration of the superior specificity of TCR c796 over c756, at any response cut-off value (defined as the fraction of the response to the index peptide at its EC90 concentration (10−7.5 M) at which a substitution is considered to be tolerated by the TCR). Numbers of unique human peptide matches, which conform to the consensus motif based on peptide X-scan data, are plotted against the response cut-off value, with solid lines representing the median number of matches derived from data from triplicate wells, and shaded areas representing the range between the lowest and highest numbers of matches from these wells. TCR c796 is shown in red, c756 in blue. (B) Motifs derived for TCR c796 identify fewer human nonamers than those for c756, at any value of p(Match) (defined as the naïve probability of identifying matching sequences within the proteome). Points represent numbers of unique human peptide matches to which the two final TCR candidates may show cross-reactivity, plotted against p(Match) values; c796 is shown as red triangles, and c756 as blue circles.
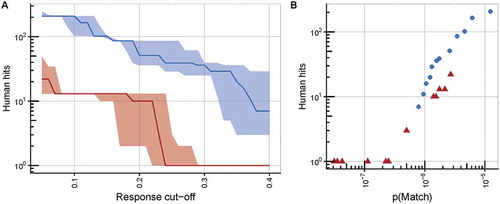
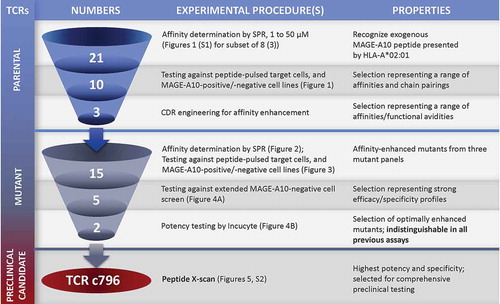
Figure 7. Schematic overview of the workflow for selecting an HLA-A*0201 MAGE-A10254-262-specific TCR candidate to progress to comprehensive pre-clinical testing.
The number of TCRs under investigation at each stage and the types of experimental procedures involved in progressing candidates from one stage to the next are shown. This resulted in two mutant TCRs with desirable functional properties that were indistinguishable by previously described assays. The X-scan approach identified c796 as the TCR with the highest potency and specificity.