Figures & data
Figure 1. Germ-line deletion of AREs within the Ifng 3ʹUTR induces superior IFN-γ production. (A) Naive CD44lowCD62Lhi WT and ARE-Del OT-I T cells were co-cultured for 24 h with OVA257-264 peptide-loaded bone marrow derived dendritic cells (DCs) as indicated. For the last 3 h, 1 μg/ml brefeldin A (BrfA) was added prior to analysis of IFN-γ (left) and TNF-α (right) production by intracellular cytokine staining. Graphs display percentage of cytokine producing T cells. (B) Representative dot plots of IFN-γ producing WT and ARE-Del T cells at day 1 (top), and day 3 (bottom) post activation as described in (A). (C) C57BL/6J/Ly5.1 mice received 1 × 10Citation3 naive WT, or ARE-Del OT-I T cells, and were infected the next day with 2 × 10⁴ LM-OVA. The % (left), and the IFN-γ production (right) of transferred OT-I T cells was determined in peripheral blood samples after 3 h incubation with BrfA by flow cytometry. (D) Representative IFN-γ stainings of WT (gray histograms) and ARE-Del (black line) T cells in peripheral blood at indicated time points. (E) Representative dot plots of mice rechallenged with 2 × 10⁵ LM-OVA 35 days post primary infection. 6 h and 24 h post infection, the IFN-γ production of splenic T cells was measured after 3 h incubation with BrfA. [Unpaired student t-test; (A) n = 3 mice per group; *p < 0.05. (C) n = 8 mice per group; **p < 0.005; ****p < 0.0001].
![Figure 1. Germ-line deletion of AREs within the Ifng 3ʹUTR induces superior IFN-γ production. (A) Naive CD44lowCD62Lhi WT and ARE-Del OT-I T cells were co-cultured for 24 h with OVA257-264 peptide-loaded bone marrow derived dendritic cells (DCs) as indicated. For the last 3 h, 1 μg/ml brefeldin A (BrfA) was added prior to analysis of IFN-γ (left) and TNF-α (right) production by intracellular cytokine staining. Graphs display percentage of cytokine producing T cells. (B) Representative dot plots of IFN-γ producing WT and ARE-Del T cells at day 1 (top), and day 3 (bottom) post activation as described in (A). (C) C57BL/6J/Ly5.1 mice received 1 × 10Citation3 naive WT, or ARE-Del OT-I T cells, and were infected the next day with 2 × 10⁴ LM-OVA. The % (left), and the IFN-γ production (right) of transferred OT-I T cells was determined in peripheral blood samples after 3 h incubation with BrfA by flow cytometry. (D) Representative IFN-γ stainings of WT (gray histograms) and ARE-Del (black line) T cells in peripheral blood at indicated time points. (E) Representative dot plots of mice rechallenged with 2 × 10⁵ LM-OVA 35 days post primary infection. 6 h and 24 h post infection, the IFN-γ production of splenic T cells was measured after 3 h incubation with BrfA. [Unpaired student t-test; (A) n = 3 mice per group; *p < 0.05. (C) n = 8 mice per group; **p < 0.005; ****p < 0.0001].](/cms/asset/53c1ca52-afc5-44fd-a0b7-9fe4dddee9e4/koni_a_1532762_f0001_b.gif)
Figure 2. ARE-Del T cells retain IFN-γ production within the tumor environment. WT and ARE-Del OT-I T cells were activated for 20 h with MEC.B7.SigOVA cells and subsequently cultured with rIL-2 for 4 days. T cells were then (A) co-cultured for 4 h with indicated amounts of B16-OVA cells in the presence of BrfA, or (B-E) injected (1 × 10⁶ WT or ARE-Del OT-I T cells) i.v. into C57BL/6J/Ly5.1+ mice bearing B16-OVA tumors that had reached a size of ~ 8mm3. 14 days later, tumors were excised and analyzed for (B) percentage of WT and ARE-Del OT-I TILs. (C-D) Intracellular staining for CD107a, TNF-α, IL-2 (C), and IFN-γ (D) of WT and ARE-Del OT-I TILs was performed ex vivo after 4 h incubation with BrfA/monensin. (E) Spleen- and tumor-derived OT-I T cells were activated for 4 h with 100 nM OVA257–264 peptide or with PMA/ionomycin in the presence of BrfA, or were left untreated (-). For representative dot plots, see Fig S1E. (A-E) Data are representative or were pooled from 3 independently performed experiments ± SD. (A) n = 4; (B-E) n = 9–12; [Unpaired student t-test; ns = non-significant; *p < 0.05, ****p < 0.0001].
![Figure 2. ARE-Del T cells retain IFN-γ production within the tumor environment. WT and ARE-Del OT-I T cells were activated for 20 h with MEC.B7.SigOVA cells and subsequently cultured with rIL-2 for 4 days. T cells were then (A) co-cultured for 4 h with indicated amounts of B16-OVA cells in the presence of BrfA, or (B-E) injected (1 × 10⁶ WT or ARE-Del OT-I T cells) i.v. into C57BL/6J/Ly5.1+ mice bearing B16-OVA tumors that had reached a size of ~ 8mm3. 14 days later, tumors were excised and analyzed for (B) percentage of WT and ARE-Del OT-I TILs. (C-D) Intracellular staining for CD107a, TNF-α, IL-2 (C), and IFN-γ (D) of WT and ARE-Del OT-I TILs was performed ex vivo after 4 h incubation with BrfA/monensin. (E) Spleen- and tumor-derived OT-I T cells were activated for 4 h with 100 nM OVA257–264 peptide or with PMA/ionomycin in the presence of BrfA, or were left untreated (-). For representative dot plots, see Fig S1E. (A-E) Data are representative or were pooled from 3 independently performed experiments ± SD. (A) n = 4; (B-E) n = 9–12; [Unpaired student t-test; ns = non-significant; *p < 0.05, ****p < 0.0001].](/cms/asset/298d8efb-5060-494e-9b11-c7c1bd9a1cad/koni_a_1532762_f0002_b.gif)
Figure 3. Sustained IFN-γ production by ARE-Del TILs results in superior anti-tumor responses. (A) Tumor size and (B) survival of B16-OVA tumor-bearing mice that were treated with 2 × 10⁶ WT OT-I, or 2 × 10⁶ ARE-Del OT-I T cells, or left untreated (no T cells) at day 7 after tumor injection. Lack of survival was defined as death or tumor size > 1000 mm3. Data represent 2 independently performed experiments. [n = 7 mice/group; Gehan-Breslow-Wilcoxon test; p < 0.0001].
![Figure 3. Sustained IFN-γ production by ARE-Del TILs results in superior anti-tumor responses. (A) Tumor size and (B) survival of B16-OVA tumor-bearing mice that were treated with 2 × 10⁶ WT OT-I, or 2 × 10⁶ ARE-Del OT-I T cells, or left untreated (no T cells) at day 7 after tumor injection. Lack of survival was defined as death or tumor size > 1000 mm3. Data represent 2 independently performed experiments. [n = 7 mice/group; Gehan-Breslow-Wilcoxon test; p < 0.0001].](/cms/asset/72795a37-e971-4b17-a788-72e6aaa6819b/koni_a_1532762_f0003_oc.jpg)
Figure 4. ARE-Del TIL therapy promotes the pro-inflammatory profile of tumor-associated macrophages. (A) Absolute numbers of live CD45+ infiltrates in tumors from mice that had received WT OT-I (grey) or ARE-Del OT-I (white) T cells. (B) Percentage of total CD3+ cells, CD3+CD8+OT-I− T cells (CD8+), CD3+CD4+FoxP3− T cells (CD4+), CD3+CD4+FoxP3+ regulatory T cells (Treg), CD3−NK1.1+ cells (NK), and CD3−CD19+ B cells of the CD45+ tumor-infiltrating population. (C-D) Percentage of CD11bhiLy6G/Chi, CD11bhiF4/80int, and CD11bhiF4/80hi cells of CD45+ population, and (D) representative dot plot of CD11bhiF4/80int and CD11bhiF4/80hi cells. (E) MHC-I (left) and MHC-II (right) expression levels on tumor-infiltrating CD11bhiF4/80int monocytes and CD11bhiF4/80hi macrophages. (F) CD206 expression on CD11bhiF4/80hi tumor-infiltrating macrophages. Data were pooled from 3 independently performed experiments ± SD. [(A-E) n = 12; (G) n = 6–9 mice/group; (C, F) Unpaired Student t-test; (E) One-way ANOVA with Tukey’s multiple comparison; ns = non-significant; *p < 0.05; **p < 0.005; ***p < 0.0005; ****p < 0.0001].
![Figure 4. ARE-Del TIL therapy promotes the pro-inflammatory profile of tumor-associated macrophages. (A) Absolute numbers of live CD45+ infiltrates in tumors from mice that had received WT OT-I (grey) or ARE-Del OT-I (white) T cells. (B) Percentage of total CD3+ cells, CD3+CD8+OT-I− T cells (CD8+), CD3+CD4+FoxP3− T cells (CD4+), CD3+CD4+FoxP3+ regulatory T cells (Treg), CD3−NK1.1+ cells (NK), and CD3−CD19+ B cells of the CD45+ tumor-infiltrating population. (C-D) Percentage of CD11bhiLy6G/Chi, CD11bhiF4/80int, and CD11bhiF4/80hi cells of CD45+ population, and (D) representative dot plot of CD11bhiF4/80int and CD11bhiF4/80hi cells. (E) MHC-I (left) and MHC-II (right) expression levels on tumor-infiltrating CD11bhiF4/80int monocytes and CD11bhiF4/80hi macrophages. (F) CD206 expression on CD11bhiF4/80hi tumor-infiltrating macrophages. Data were pooled from 3 independently performed experiments ± SD. [(A-E) n = 12; (G) n = 6–9 mice/group; (C, F) Unpaired Student t-test; (E) One-way ANOVA with Tukey’s multiple comparison; ns = non-significant; *p < 0.05; **p < 0.005; ***p < 0.0005; ****p < 0.0001].](/cms/asset/3b34b01d-cab2-4edd-908d-ba11cd6f5e63/koni_a_1532762_f0004_b.gif)
Figure 5. ARE-Del T cell therapy directly alters the tumor cell phenotype and growth. (A) Ex vivo PD-L1, MHC-I and MHC-II expression levels of tumor cells isolated from tumor-bearing mice treated with WT or ARE-Del OT-I T cells. Data pooled from 4 (PD-L1 and MHC-II; n = 19) and 2 (MHC-I; n = 6–8) independently performed experiments (mean ± SD). [Unpaired Student t-test; **p < 0.005; ***p < 0.0005]. (B-C) B16-OVA IFN-γR−/- and Cas9 control tumor cells were cultured with or without 50IU rIFN-γ. (B) Cell were counted at indicated times (mean ± SD; n = 3). (C) B16-OVA cells were labeled with CFSE, and cell proliferation was monitored by flow cytometry as determined by loss of CFSE expression. Representative of n = 3. (D) 8 days after WT or ARE-Del OT-I T cell transfer, tumor cell proliferation was assessed 2.5 h after i.p. injection of BrdU in B16-OVA tumor-bearing mice. Left: Absolute numbers of BrdU+ CD45− CD4+ B16-OVA tumor cells analyzed directly ex vivo. Right: ex vivo IFN-γ production of transferred OT-I T cells after 3 h incubation with BrfA (mean ± SD; n = 3–6 mice/group). [Unpaired Student t-test; *p < 0.05]. (E) Survival curve of mice challenged with Cas9 control or IFN-γR−/- B16-OVA cells treated with WT or ARE-Del OT-I T cells. [n = 7 and n = 6 mice per control and IFN-γR−/- groups, respectively; Gehan-Breslow-Wilcoxon test]. Data represent 2 independently performed experiments.
![Figure 5. ARE-Del T cell therapy directly alters the tumor cell phenotype and growth. (A) Ex vivo PD-L1, MHC-I and MHC-II expression levels of tumor cells isolated from tumor-bearing mice treated with WT or ARE-Del OT-I T cells. Data pooled from 4 (PD-L1 and MHC-II; n = 19) and 2 (MHC-I; n = 6–8) independently performed experiments (mean ± SD). [Unpaired Student t-test; **p < 0.005; ***p < 0.0005]. (B-C) B16-OVA IFN-γR−/- and Cas9 control tumor cells were cultured with or without 50IU rIFN-γ. (B) Cell were counted at indicated times (mean ± SD; n = 3). (C) B16-OVA cells were labeled with CFSE, and cell proliferation was monitored by flow cytometry as determined by loss of CFSE expression. Representative of n = 3. (D) 8 days after WT or ARE-Del OT-I T cell transfer, tumor cell proliferation was assessed 2.5 h after i.p. injection of BrdU in B16-OVA tumor-bearing mice. Left: Absolute numbers of BrdU+ CD45− CD4+ B16-OVA tumor cells analyzed directly ex vivo. Right: ex vivo IFN-γ production of transferred OT-I T cells after 3 h incubation with BrfA (mean ± SD; n = 3–6 mice/group). [Unpaired Student t-test; *p < 0.05]. (E) Survival curve of mice challenged with Cas9 control or IFN-γR−/- B16-OVA cells treated with WT or ARE-Del OT-I T cells. [n = 7 and n = 6 mice per control and IFN-γR−/- groups, respectively; Gehan-Breslow-Wilcoxon test]. Data represent 2 independently performed experiments.](/cms/asset/63bbf8c8-2152-4a11-a7bc-ef20e8fdcc31/koni_a_1532762_f0005_oc.jpg)
Figure 6. Superior IFN-γ production by ARE-Del TILs correlates with increased mRNA stability. (A) Ifng mRNA expression of FACS-sorted spleen- and tumor-derived OT-I T cells (pooled from 2–4 mice), 14 days after i.v. T cell transfer in B16-OVA tumor bearing mice. Data were pooled from 4 independently performed experiments (mean ± SD; n = 9 mice/group). [One-way ANOVA with Tukey’s multiple comparison; *p < 0.05; ****p < 0.0001]. (B-E) WT and ARE-Del OT-I T cells were co-cultured with B16-OVA (B-C) or MC38-OVA (D-E) cells at a 6:1 effector:target (E:T) ratio for indicated time. B16-OVA or MC38-OVA cells were refreshed daily. (B, D) Intracellular IFN-γ and TNF-α staining was performed at day 1 to 3 after adding BrfA during the last 2 h of culture. (C, E) Ifng mRNA expression was analyzed by RT-PCR. Representative dot plots (B) and pooled data ± SD (C-E) from 4 (B-C) and 2 (D-E) independently performed experiments. [Unpaired Student t-test; *p < 0.05; **p < 0.005]. (F-G) Ifng mRNA decay of resting T cells, and of T cells co-cultured in vitro with B16-OVA or MC38-OVA cells for 1 or 3 days (F), or Ifng mRNA decay of in vivo tumor derived WT and ARE-Del TILs (G) measured by adding 1 μg/ml ActD for indicated time points. Presented data are pooled from 4 (n = 5; F) and 2 (n = 5; G) independently performed experiments (mean ± SD). [Unpaired Student t-test; *p < 0.05; **p < 0.005; ***p < 0.0005].
![Figure 6. Superior IFN-γ production by ARE-Del TILs correlates with increased mRNA stability. (A) Ifng mRNA expression of FACS-sorted spleen- and tumor-derived OT-I T cells (pooled from 2–4 mice), 14 days after i.v. T cell transfer in B16-OVA tumor bearing mice. Data were pooled from 4 independently performed experiments (mean ± SD; n = 9 mice/group). [One-way ANOVA with Tukey’s multiple comparison; *p < 0.05; ****p < 0.0001]. (B-E) WT and ARE-Del OT-I T cells were co-cultured with B16-OVA (B-C) or MC38-OVA (D-E) cells at a 6:1 effector:target (E:T) ratio for indicated time. B16-OVA or MC38-OVA cells were refreshed daily. (B, D) Intracellular IFN-γ and TNF-α staining was performed at day 1 to 3 after adding BrfA during the last 2 h of culture. (C, E) Ifng mRNA expression was analyzed by RT-PCR. Representative dot plots (B) and pooled data ± SD (C-E) from 4 (B-C) and 2 (D-E) independently performed experiments. [Unpaired Student t-test; *p < 0.05; **p < 0.005]. (F-G) Ifng mRNA decay of resting T cells, and of T cells co-cultured in vitro with B16-OVA or MC38-OVA cells for 1 or 3 days (F), or Ifng mRNA decay of in vivo tumor derived WT and ARE-Del TILs (G) measured by adding 1 μg/ml ActD for indicated time points. Presented data are pooled from 4 (n = 5; F) and 2 (n = 5; G) independently performed experiments (mean ± SD). [Unpaired Student t-test; *p < 0.05; **p < 0.005; ***p < 0.0005].](/cms/asset/ffb8891b-cc82-464d-a703-2c3e17fcd5aa/koni_a_1532762_f0006_b.gif)
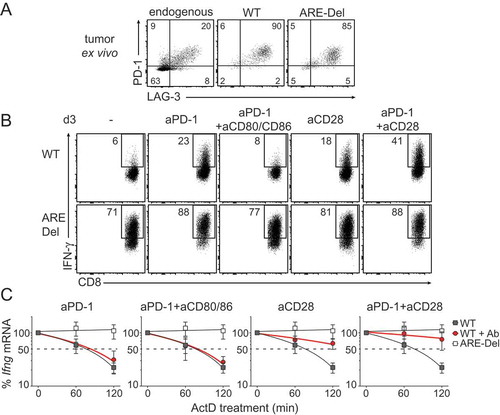
Figure 7. CD28 triggering restores Ifng mRNA stability of WT TILs. (A) Representative dot plot of PD-1 and Lag-3 expression of endogenous CD8+ TILs, WT and ARE-Del OT-I TILs analyzed directly ex vivo 14 days after T cell transfer in B16-OVA tumor bearing mice. For pooled data see Fig S2B. (B-C) WT and ARE-Del OT-I T cells were co-cultured in vitro with B16-OVA cells as described above for 3 days. When indicated, T cells were daily treated with 10 μg/ml anti-PD1 blocking antibody, with 10 μg/ml anti-CD28 antibody, with 10 μg/ml anti-CD80 and 10 μg/ml anti-CD86 blocking antibodies, or a combination thereof. (B) IFN-γ protein production was assessed by flow cytometry upon addition of BrfA during the last hour of culture. For pooled data see Fig S2C. (C) Ifng mRNA decay was measured by adding 1 μg/ml ActD for indicated time points (n = 5). Representative dot plots (B) or data pooled ± SD (C) from 4 independently performed experiments.