Figures & data
Figure 1. Schematic diagram of N-809, PD-L1 binding, and effects of N-809 on the proliferation and activity of CD4 and CD8 T cells. (a) Illustration of N-809, a bifunctional molecule created by fusing two single chain human anti-PD-L1 domains to an IL-15 superagonist scaffold with an IgG1 Fc portion. (b) Binding of N-809 to PD-L1+ H441 cells was analyzed by flow cytometry using APC labeled antibody specific for the Fc portion of hIgG. (c, d) Healthy donor CD4 and CD8 T cells were stimulated with plate-bound anti-CD3 and increasing concentrations of N-809. Fold change represents the change from untreated (0 ng/ml), anti-CD3 stimulated T cells for one representative donor. (e) Tumor cell lysis by an HPV E7-specific T cell line grown in the presence or absence of N-809 (37.5 ng/ml). Results of a lysis assay using CaSki (cervical carcinoma) cells as targets at a 10:1 E:T ratio is shown. MDA-MB-231 (breast carcinoma) cells were used as a control to determine specificity of the lysis. **P < 0.01.
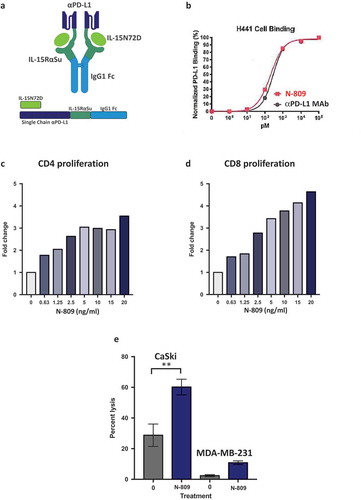
Figure 2. Effects of N-809 treatment on CD4 and CD8 T cell gene expression. Healthy donor (HD) CD4 and CD8 T cells were incubated ±N-809 (37.5 ng/ml) for 24h prior to RNA isolation for RNASeq analysis using the NantOmics panel of immune related genes. (a, c) Heat maps depicting gene expression analysis for genes that were up- or downregulated ≥3-fold after N-809 treatment compared to no treatment, for CD4 (a, one donor) or CD8 (c, two donors) T cells. (b, d) Graphs depicting the fold change for the genes in a and c, respectively. (e) Table showing the number of genes differentially expressed in N-809 treated cells vs. the untreated control.
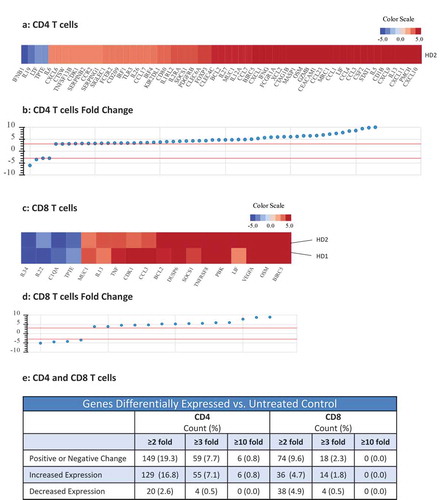
Figure 3. Effects of N-809 on NK cell phenotypic markers. Healthy donor NK cells were incubated ±N-809 (37.5 ng/ml) for 24h before being stained for multicolor flow cytometry. (a) Table of markers with increased or decreased expression after N-809 treatment. (b) Representative histograms of four phenotypic NK markers showing the change in expression between untreated cells (blue outline) and N-809‒treated cells (red shaded). Perforin expression was >90% for 3/4 donors, with a slight increase in percent expression and MFI after N-809 treatment, whereas the donor with the lowest expression levels (78.9%) had a greater increase in perforin with treatment. Markers that were stained for, but did not consistently change with treatment: CD11a, CD11c, CD158a, CD56, CD27, FasL, TRAIL, PD-L1, and 2B4. Similar results were seen for three additional donors (Supplemental Table S3).
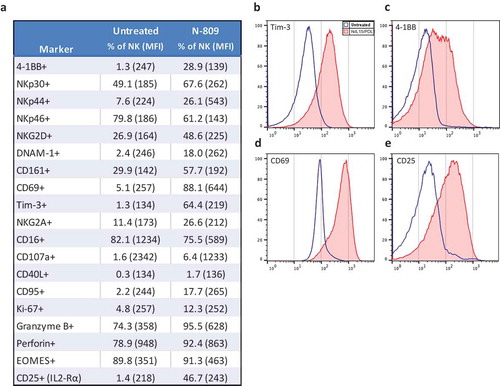
Figure 4. Effects of N-809 treatment on NK cell gene expression. Healthy donor NK cells were incubated ±N-809 (37.5 ng/ml) for 24h prior to RNA isolation for RNASeq analysis using the NantOmics panel of immune related genes. (a) Heat map of gene expression analysis for genes that were up- or downregulated ≥3-fold in both donors after N-809 treatment compared to no treatment. (b) Graph depicting the fold change for the genes in (a). (c) Table showing the number of genes differentially expressed in N-809 treated cells vs. the untreated control.
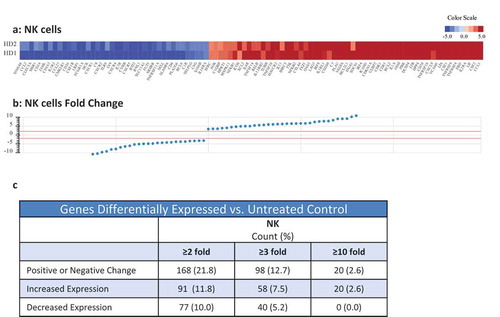
Figure 5. Treatment of NK cells with, or exposure of tumor cells to N-809 increased NK lysis. (a, e, i) Schematics of experimental procedures. All tumor lysis assays were performed using as targets: H441 (lung carcinoma), CaSki (cervical carcinoma), and MDA-MB-231 (breast carcinoma) at a 10:1 E:T ratio. Results from one representative donor are shown for each experiment. (b–d) NK cells were treated ±different concentrations of N-809 prior to being added to the tumor cells. (f-h): Tumor cells were exposed to IgG1 control or N-809 at concentrations up to 40 ng/ml before addition of untreated NK cells. (j, k) Tumor cells were exposed to no MAb, IgG1 control, or N-809 (3.75 ng/ml) before NK cells were added. NK cells had been pre-incubated ±anti-CD16 MAb (25 µg/ml). (l) MDA-MB-231 cells were exposed to N-809 (10 ng/ml). NK cells had been pre-incubated ±anti-CD16 MAb (25–100 µg/ml).
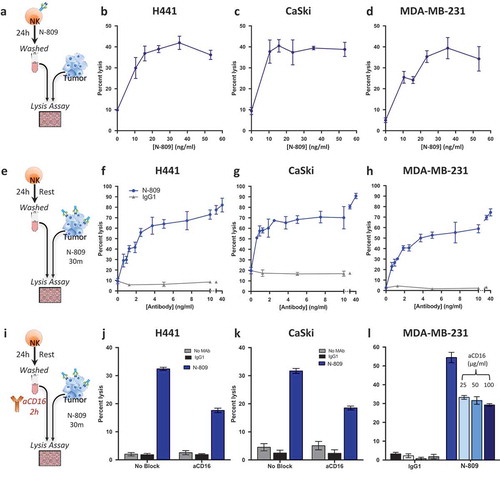
Figure 6. Treating NK cells with N-809, combined with tumor cell exposure to N-809, resulted in the highest levels of tumor cell lysis. (a, e, i, m) Schematics of experimental procedures. Healthy donor (b–d) and cancer patient (j–l) NK cells were incubated ±N-809 (37.5 ng/ml), washed, and added to the lysis assay at a 10:1 E:T ratio. Tumor cells were exposed to IgG1 control or N-809 (20 ng/ml) before NK cells were added. Results from one representative healthy donor and one of two cancer patients are shown using three human tumor cell lines as targets: H441 (lung carcinoma, b and j), CaSki (cervical carcinoma, c and k), and MDA-MB-231 (breast carcinoma, d and l). (f–h and n–p) NK cells were treated as above. Tumor cells were exposed to IgG1 control or cetuximab (10 ng/ml) before NK cells were added. Similar results were observed in additional donors and an additional cancer patient. Tables display drug exposure of NK cells and tumor cells.
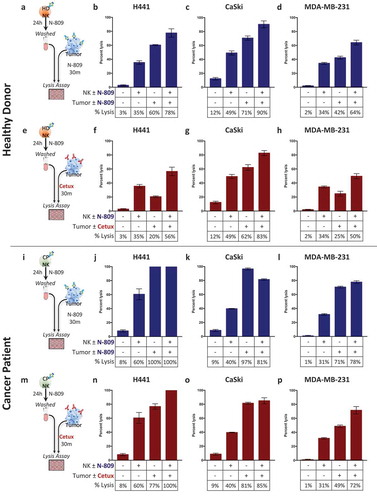
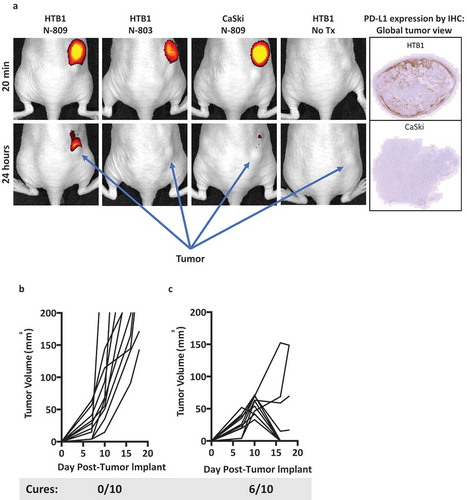
Figure 7. (a) In vivo imaging of N-809. Athymic mice were implanted with 2 × 10Citation6 HTB1 or 4 × 10Citation6 CaSki tumor cells on the right flank. N-809 and N-803 were fluorescently labeled as described in Materials and Methods. When tumors reached 5–6 mm on one side, 100 µg of labeled N-809 or N-803 was injected ipsilaterally to the tumor, and imaged and analyzed using IVIS Imaging Living Image software. (b, c) MC38-CEA tumor cells (3 × 10Citation5) were implanted into the right flank of CEA transgenic female mice. On days 8 and 12 after tumor implant, mice were treated ipsilaterally on the trunk with (b) PBS (100 μl, s.c.) or (c) N-809(mu) (100 μg, s.c.). Graphs show tumor growth curves of individual mice (n = 10/group). Caption denotes number of cured animals in each treatment group.