Figures & data
Figure 1. Numbers of differentially expressed genes according to IDH status in four groups of samples. Genes were analyzed in four cohorts: low-grade gliomas in CGGA cohort (CGGA LGGs), glioblastomas in CGGA cohort (CGGA GBMs), low-grade gliomas in TCGA cohort (TCGA LGGs), and glioblastomas in TCGA cohort (TCGA GBMs). Genes that were both significant in Student’s t-test (p < 0.05) and SAM (FDR < 0.01) were counted. Each digit represents the number of significantly upregulated genes in the corresponding group. The overlapped genes across four groups were selected for further survival analysis.
Figure 2. Levels of ISG20 expression relative to common pathological and molecular markers in glioma. (a) ISG20 expression according to WHO grade in the CGGA dataset. (b) ISG20 expression according to GBM molecular subtypes (proneural, N = 33; neural, N = 12; classical, N = 48; mesenchymal, N = 51) in the CGGA dataset. (c) ISG20 expression according to 1p-19q-codeletion status (1p19q-codeleted, N = 63; 1p19q-non-codeleted, N = 118) in the CGGA dataset. (d) ISG20 expression according to different IDH mutation status in WHO grade II gliomas, grade III gliomas and GBMs in the CGGA dataset. WHO grade II: IDHmut, N = 94 and IDHwt, N = 15; WHO grade III: IDHmut, N = 37 and IDHwt, N = 35; WHO grade IV: IDHmut, N = 36 and IDHwt, N = 108. (e) Levels of expression and representative photographs of immunohistochemical staining of ISG20 in different grades of gliomas. (f) Levels of expression and representative photographs of immunostaining of ISG20 in IDHwt and IDHmut tumors. Positive cells are stained brown. Magnification, x400. Data are presented as means ± SEM. Student’s t-test was used to compare ISG20 expression between two groups.
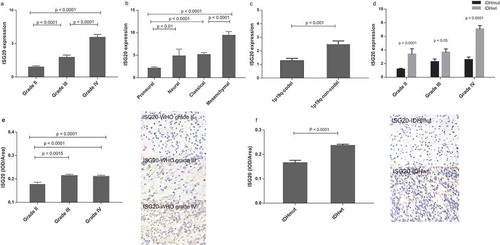
Table 1. Correlation of ISG20 and common clinicopathological factors with patients’ survival in the CGGA and TCGA datasets. Each variable was correlated with survival time using univariate and multivariate Cox regression analyses. The p-value, hazard ratio (HR) and 95% confidence interval (95% CI) for each analysis are listed.
Figure 3. Kaplan-Meier analyses of overall survival in CGGA cohort according to ISG20 expression level. Samples were divided into high- and low-ISG20 expression groups based on the median expression level of ISG20. (a) Patients with IDH mutant tumors. (b) Patients with IDH wild-type tumors. (c) WHO grade II glioma patients. (d) WHO grade III glioma patients. (e) WHO grade IV glioma patients. Discriminative power of ISG20 was assessed with Kaplan-Meier plotting method and the Log-rank test. NS, no significance.
Figure 4. The top bioinformatics hits of biological pathways derived from ISG20-correlated genes in the CGGA cohort. Column length (upper coordinates): enrichment gene counts; polyline (lower coordinates): -log10 p-value (p < 0.05).
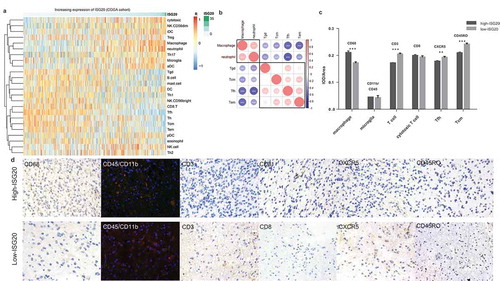
Figure 5. Analysis of tumor immune cell infiltration relative to the ISG20 level in the CGGA dataset. (a) Correlation of 24 immune cell subpopulations with ISG20 expression in CGGA dataset. Each colored square within the figure illustrates the correlation between ISG20 and the transcriptional profile of the corresponding immune cell type. Red color illustrates a very strong positive correlation (r = 1), white no correlation (r = 0), and blue a negative correlation (r = −1). (b) Mutual relationship of ISG20-correlated immune cells in CGGA dataset. Plot size and color depth show the intensity of the relationship: red, positive correlation; blue, negative correlation; larger plot indicates a stronger correlation. *p < 0.05, **p < 0.01, ***p < 0.001. (c) Analysis of intratumoral immune cell infiltrates relative to ISG20 expression. Immune cell infiltrates from 43 glioma patients were analyzed by immunohistochemistry. Macrophages (quantified with marker CD68), microglia (CD45 + CD11b), T cells (CD3), cytotoxic T cells (CD8), Tfh cells (CXCR5), memory T cells (CD45RO) were stained. Expression of marker for macrophages increased with increasing ISG20 expression. In contrast, markers for T cells, Tfh cells, and Tcm cells were decreased in high ISG20 expression tumors. Markers for microglia and cytotoxic T cells did not show significant change. (d) Photographs of immunohistochemical staining of each marker in high- and low-ISG20 expression tumors. For CD68, CD3, CD8, CXCR5 and CD45RO, positive cells are stained brown. For CD45 + CD11b, positive cells are stained orange (after merging FITC and CY3 emission signal). Magnification, x400. IHC, immunohistochemistry; high-ISG20, high expression of ISG20; Low-ISG20, low expression of ISG20, **p < 0.01, ***p < 0.001.