Figures & data
Table 1. Characteristics of ovarian cancer patients (n = 35).
Figure 1. Characterization of general immune cell composition in peripheral blood (n = 35), ascites (n = 30) and tumor tissue (n = 35) of ovarian cancer patients. (A) Median proportion of CD3+ and CD3- cells (gated from lymphocytes), CD4+ and CD8+ T-cells (gated from CD3+ T-cells), and memory/maturation stages of total T-cells (gated from CD3+ T-cells): TN (naïve), TCM (central memory), TEM (effector memory), and TTD (terminally differentiated). Results from Friedman test are presented for each row. All individual values are shown for (B) CD4+ and CD8+ T-cells; (C) maturation stages of total T-cells; (D) γδ T-cells; E) regulatory T-cells (Treg, defined as CD4+/CD25highCD127-/low); (F) NK-cells and B-cells; and (G) CD14+ monocytes; myeloid marker CD33 and co-expression of CD14/CD33. (H) Representative plots from all presented populations are shown from patient 45, values in plots represent percentages. Significant differences were obtained by Wilcoxon signed rank test followed by Bonferroni correction. Median values and interquartile ranges are plotted in graphs. Significance levels were set to p < 0.05 (*), p < 0.01 (**), and p < 0.001 (***).
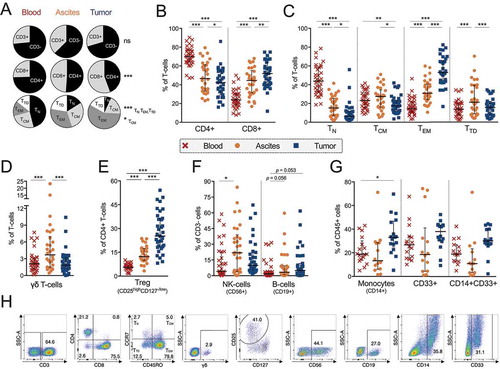
Figure 2. Co-inhibitory receptor profiling on CD4+ and CD8+ T-cells isolated from peripheral blood (n = 35), ascites (n = 30) and tumor tissue (n = 35) of ovarian cancer patients. (A) Proportion of CD4+ (left) or CD8+ (right) T-cells expressing co-inhibitory receptors LAG-3, PD-1, TIM-3 or CTLA-4. Representative plots of LAG-3, PD-1, TIM-3 and CTLA-4 in tumor tissue (gated from total CD3+ T-cells) from patient 27 are shown. (B) Correlations between CD4+ (left) and CD8+ (right) T-cells expressing LAG-3, PD-1 or TIM-3 in ascites and tumor tissue. (C) Boolean gating analysis was performed on LAG-3, PD-1 and TIM-3. Graphs show number of co-inhibitory receptors expressed on CD4+ T-cells (left) and CD8+ T-cells (right). Dashed vertical lines in graphs are plotted to emphasize changes in axis. (D) Median values of total number of co-inhibitory receptors expressed by CD4+ or CD8+ T-cells (by Boolean gating). (E) Co-expression of LAG-3, PD-1 and/or TIM-3 in ascites (left) and tumor tissue (right). Significant differences were obtained by Wilcoxon signed rank test followed by Bonferroni correction. Spearman’s rank coefficient was used for correlation analysis and non-linear regression was also applied. Median values and interquartile ranges are plotted in graphs. Significance levels were set to p < 0.05 (*), p < 0.01 (**), and p < 0.001 (***).
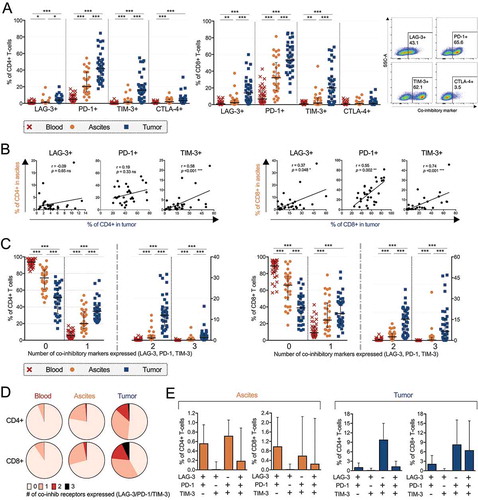
Figure 3. Characterization of activation markers, co-stimulatory receptors and cytokine receptors on CD4+ and CD8+ T-cells isolated from peripheral blood (n = 35), ascites (n = 30) and tumor tissue (n = 35) of ovarian cancer patients. Proportion of (A) CD4+ and (B) CD8+ T-cells expressing various markers. Stainings for HLA-DR and CD103 are presented with fewer samples due to being added later in the study panel (n = 8 for blood and tumor, n = 7 for ascites). (C) Representative histograms for each marker is presented from patient 45 (gated from total T-cells), isotype controls were made on cells isolated from tumor. Significant differences were obtained by Wilcoxon signed rank test followed by Bonferroni correction. Median values and interquartile ranges are plotted in graphs. Significance levels were set to p < 0.05 (*), p < 0.01 (**), and p < 0.001 (***).
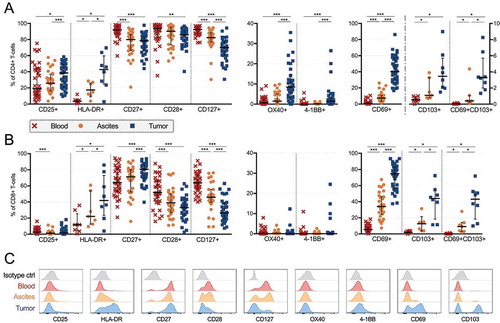
Table 2. Cytokine and chemokine profiling by multiplex immunoassay on ascites supernatants, blood plasma and tumor tissue supernatants.
Figure 4. Cytokine and chemokine profiling by multiplex immunoassay on blood plasma (n = 32), ascites fluid (n = 28) and tumor tissue supernatant (n = 32) from ovarian cancer patients. (A) Significant differences between ascites and blood. Soluble factors increased in ascites are shown to the left while the only soluble which was decreased in concentration in ascites compared to blood is presented to the right. (B) All analytes which had a median above detection limit (> 3.2 pg/mL) in tumor supernatants are plotted with equivalent analyte concentrations found in ascites. Only significant differences where concentrations were elevated in tumor were specified (left part of graph) due to dilution of tumor supernatants. Statistical comparisons were made using Wilcoxon signed rank test. Median values and interquartile ranges are plotted in graphs. Significance levels were set to p < 0.05 (*), p < 0.01 (**), and p < 0.001 (***).
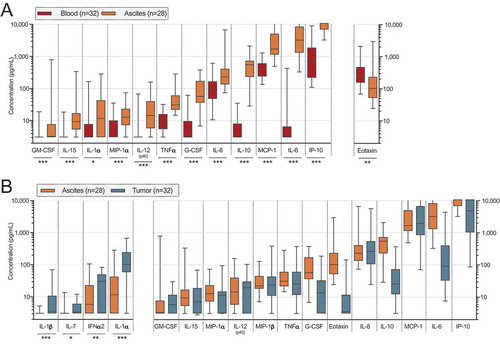
Figure 5. Clinical parameters and differences in proportion of cell subsets and concentrations of soluble factors in ascites (left) and tumor tissue (right) of ovarian cancer patients. Patients were grouped according to (A) FIGO stage (stage III n = 24; IV n = 11); (B) remaining residual tumor after surgery (optimal n = 20; suboptimal n = 15); (C) pre-surgery serum (s-) measurement of cancer antigen (CA)-125 (≤ median 911 IU/mL n = 18; > 911 IU/mL n = 17). Groups were compared using Mann Whitney U-test. Box plots show median values, interquartile ranges and min-max values. Significance levels were set to p < 0.05 (*), p < 0.01 (**), and p < 0.001 (***). Soluble factors distinguished by filled pattern.
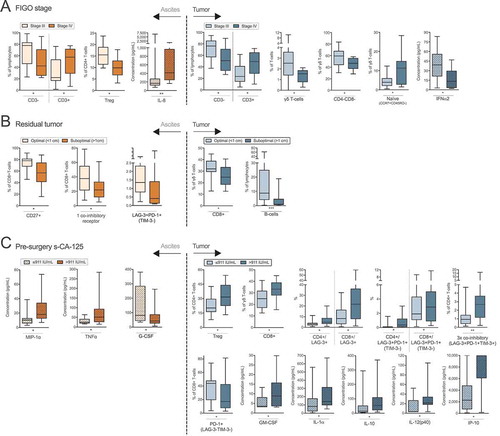
Figure 6. Identification of risk factors in ascites and tumor tissue for reduced survival of ovarian cancer patients. Prognosis for patients was affected by (A) residual tumor burden after surgery. Also, survival was correlated to eight immune-related factors (B-I). Increased concentrations of soluble (B) IFNα2, (C) MIP-1α and (D) MIP-1β in ascites were correlated to a worse prognosis for patients in our cohort. Also, the proportion of ascites-isolated (E) CD8+ T-cells expressing only TIM-3 (and being negative for LAG-3 and PD-1); (F) CD4+ γδ T-cells; and tumor tissue-derived (G) CD4+ γδ T-cells; (H) CD8+ T-cells without expression of LAG-3, PD-1 or TIM-3; I) TIM-3+ CD8+ T-cells expressing CD127 were identified to be significantly correlated with survival. Groups were made based on median values of the complete cohort and significances were obtained by log-rank test. Differences in number of patients are due to full profiling not being performed for all patients. Significance levels were set to p < 0.05 (*), p < 0.01 (**), and p < 0.001 (***).
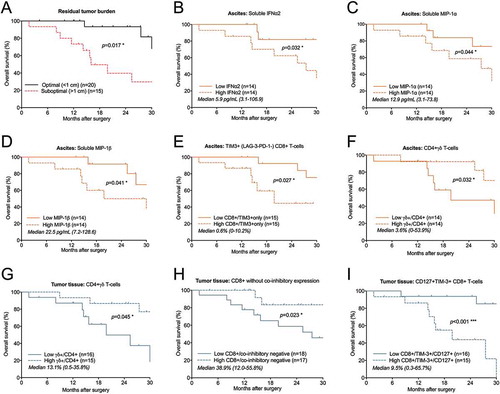
Figure 7. Risk factor analysis based on prognostic immune-related findings in ascites and tumor tissue of ovarian cancer patients. Risk factors were grouped using: (A) all eight immune-related risk factors (= high levels of soluble IFNα2/MIP-1α/MIP-1β in ascites, high % TIM-3+(PD-1-LAG-3-) CD8+ T-cells in ascites, low % CD4+ γδ T-cells in ascites and tumor, low % tumor-isolated CD8+ co-inhibitory negative T-cells, high % tumor-isolated CD127+TIM3+ CD8+ T-cells; (B) the five (three soluble and two cellular) ascites-related risk factors; (C) the three cellular tumor tissue-related risk factors; (D) and CD4+ γδ T-cells in ascites and tumor tissue. Low and high indicate below or above median value. Risk factor analysis was performed using log-rank test and survival curves were plotted using Kaplan-Meier. Significance levels were set to p < 0.05 (*), p < 0.01 (**), and p < 0.001 (***).
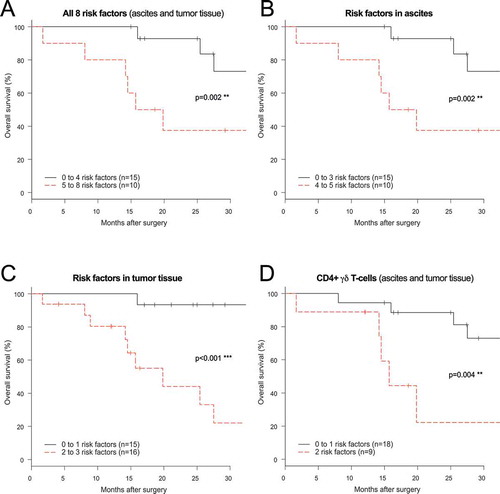
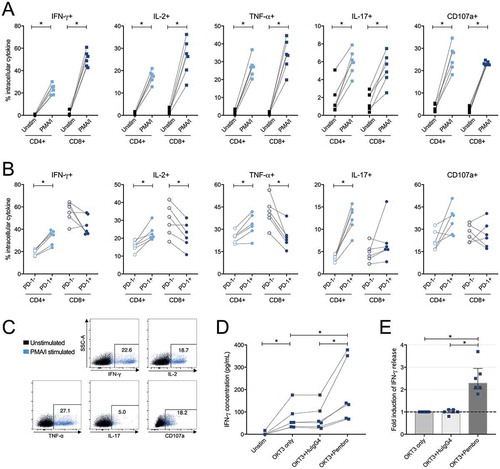
Figure 8. Intracellular cytokine production in CD4+ and CD8+ tumor-derived T-cells upon stimulation with phorbol 12-myristate 13-acetate/ionomycin (PMA/I) and release of IFN-γ after stimulation with anti-CD3 and PD-1 blockade. (A) Tumor-infiltrating lymphocytes isolated from tumor tissue from six ovarian cancer patients were assessed at two conditions; unstimulated (unstim) and stimulated with PMA/I for 6 hours. Intracellular cytokine staining was performed for IFN-γ, IL-2, TNF-α, IL-17 and CD107a on total CD4+ or CD8+ T-cells to assess functional capacity ex vivo. (B) Stimulated CD4+ and CD8+ T-cells were divided based on being PD-1- or PD-1+ and the production of the different analytes was thereafter analyzed. (C) Representative plots from intracellular cytokine staining on total CD4+ T-cells stimulated with PMA/I for 6 hours from patient 33. (D) Tumor-derived T-cells (n = 6) were stimulated with anti-CD3 (OKT3) and PD-1-blocking antibody pembrolizumab (pembro) or negative control (human IgG4, HuIgG4) for 48 hours. The release of IFN-γ was analyzed in the supernatants by ELISA. The data has been normalized to reflect the same number of T-cells and the concentration refers to per 500,000 T-cells. Dashed lines connects the same patient. (E) Fold increase of released IFN-γ by addition of PD-1 blocking antibody (pembro) or negative control (HuIgG4) relative to when adding only anti-CD3. Significant differences were obtained by Wilcoxon signed rank test and significance levels were set to p < 0.05 (*), p < 0.01 (**), and p < 0.001 (***).