Figures & data
Figure 1. RNA-sequencing analysis on PRE and EDT FFPE tissue biopsies of stage IV melanoma patients treated with anti-PD-1 therapy.
(a) Unsupervised Euclidean hierarchical cluster heat map of NK cell related genes in PRE treatment tissue between anti-PD-1 responding (n = 10) and non-responding patients (n = 11). (b) Unsupervised Euclidean hierarchical clustering heat map of NK cell related genes in EDT treatment tissue between anti-PD-1 responding (n = 5) and non-responding patients (n = 4).
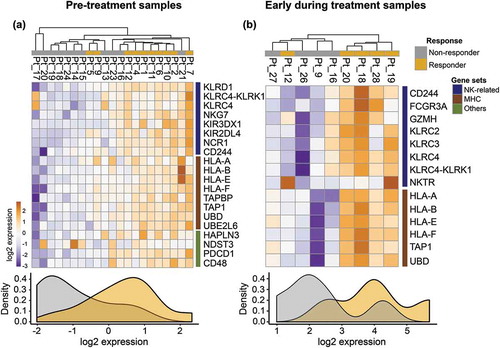
Figure 2. Quantitative multiplex fluorescent image analysis of NK cells in baseline FFPE and NK cell phenotyping by flow cytometry.
NK cell phenotype and activation were evaluated on baseline FFPE tissue biopsies in 12 responding (R) and 13 non-responding (NR) stage IV melanoma patients treated with anti-PD-1 therapy (a) Intratumoral vs. peritumoral count of NK cells/mm2 in responders and non-responders. (b) Intratumoral vs. peritumoral count of CD16+ NK cells/mm2 in responders and non-responders. (c) Intratumoral vs. peritumoral count of GRZB+ NK cells/mm2 in responders and non-responders. Tumor dissociates from five stage III melanoma patients were analyzed for CD69, PD-1, CD16 and CD57 expression on NK (orange) and CD8+ (red) T cells. (d) Gating strategy used to identify CD56 + CD3- NK cells and CD3 + CD8 + T cells. (b) PD-1, CD69, CD57 and CD16 expression (%) on NK and CD8 + T cells. (e) PD-1, CD69, CD57 and CD16 expression (%) on NK and CD8 + T cells. (f) Multiplex fluorescent images comparing CD56, CD16 and GRZB staining in responders and non-responders. DAPI represents the nucleus. The arrows represent colocalization of CD56 and CD16 or CD56 and GRZB. Error bars represent the standard error of the mean. P values were obtained by Mann-Whitney U test. *P < 0.03; **P < 0.0021. Error bars represent the standard error of the mean. Abbrev. T: T cells; NK: Natural killer cells.
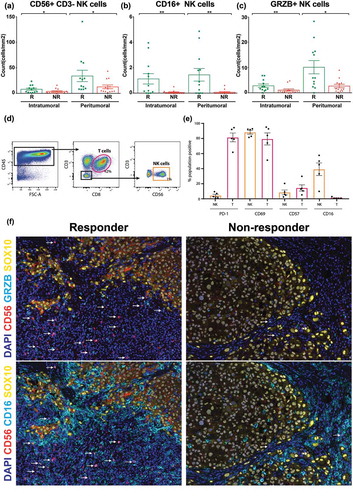
Figure 3. Spatial distribution of NK cells with melanoma cells.
Representative images of an area from a responding patient (a) and a non-responding patient (b) to PD-1 treatment for spatial distribution analysis. (c) and (d) Cell location maps of the T cells, NK cells and tumor cells in representative responding and non-responding patients. (e) and (f) Visual depiction of the nearest neighbor calculation between NK cells and tumor cells. (g) NK cell distance to tumor cells. (h) NK cell distance to tumor cells with low MHC class I expression.
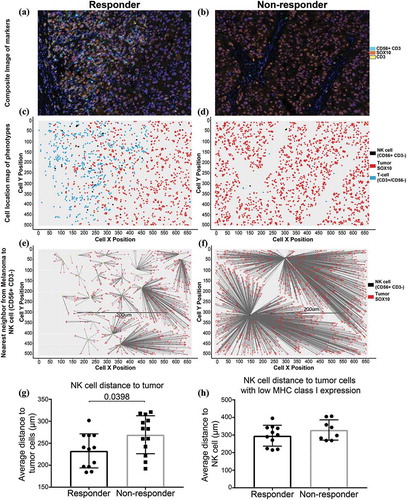
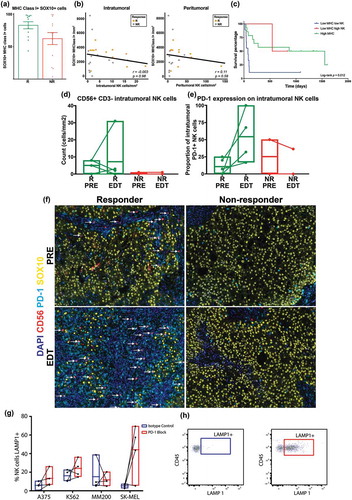
Figure 4. Anti-PD-1 treated patients with high tumor infiltrating NK cells and low MHC class I+ melanomas have improved survival.
(a) Percentage of MHC class I+ melanoma cells between responders and non-responders. (b) Correlation between MHC class I and intra- or peri-tumoral NK cells. (c) Kaplan-Meier analysis of patients with high MHC class I expression (n = 14; low MHC high NK vs high MHC log-rank p = 0.91), low MHC class I expression with low NK cell density (n = 9) and low MHC class I expression with high NK cell density (n = 2; low MHC high NK vs low MHC low NK log-rank p = 0.12). Both patients with low MHC class I expression and high NK cell density category were responders to anti-PD-1 therapy. (d) Intratumoral CD3- CD56+ NK cells were investigated by multiplex IHC in PRE-EDT matched samples from 5 responding and 2 non-responding stage IV melanoma patients treated with anti-PD-1 therapy. (e) Proportion of intratumoral PD-1+ NK cells in matched PRE-EDT samples from stage IV melanoma patients treated with anti-PD-1 therapy. (f) Multiplex fluorescent IHC images of PRE-EDT biopsies from a representative responder and non-responder stage IV melanoma patient treated with anti-PD-1. CD56+ (red) NK cells are shown to co-localize (white arrow) with PD-1 (blue). (g) The effect of PD-1 blockade on NK cell cytotoxicity. Four stage IV melanoma patients had NK cells isolated from their PBMCs and they were co-cultured with either A375, MM200, K562 or SK-MEL-28 cell lines after the addition of a PD-1 blocking antibody or IgG isotype control. LAMP-1 expression on NK cells was measured by flow cytometry as readout of cytotoxicity. (h) Example density plot of LAMP1 + NK cells treated with IgG isotype control (blue) or anti-PD-1 (red).