Figures & data
Figure 1. Clusters of cytokine serum levels in relation to prognosis.
(A) Principal component analysis was performed using the serum levels of the 27 cytokines measured by Luminex. Scatter plot of principal component 1 and 2 are represented, each dot represents a sample projected in the two main principal components (PC1 and PC2); the dots are colored according to the cohort they belong to. (B) Unsupervised clustering of cytokine levels in the MicMa cohort (n = 131) using the R package pheatmap with Euclidean distance and Ward.D linkage. Annotations of the rows of the heatmap indicate histopathological features of the patients: ER and HER2 statuses. Cytokines in columns are annotated in regard to the classical function they exert according to the literature. Cluster were identified using cutree, dendrogram of the unsupervised clustering was colored to identify clusters, in addition solid line boxes highlight the 4 clusters. (C & D) Sample-wise enrichment scores for cluster-4-cytokines was calculated using Gene Set Variation Analysis (GSVA) and the 8 cytokines of cluster 4 (FGF, VEGF, GM-CSF, PDGF, IL17, IL5, IL4, IL15). MicMa and DCTB samples were divided in two groups (high and low score) according to the median for the MicMa and the density distribution of the score plotted in Supplementary Figure 1 for the DCTB. Kaplan-Meier survival curves for the high (red) and low (blue) cluster-4-cytokines scores are depicted for MicMa (C) and DCTB (D). The p-values are from log-rank tests. Hazard Ratio ± 95% confidence interval are shown, for the DCTB cohort the Hazard Ratio was not calculable due to small events rates.
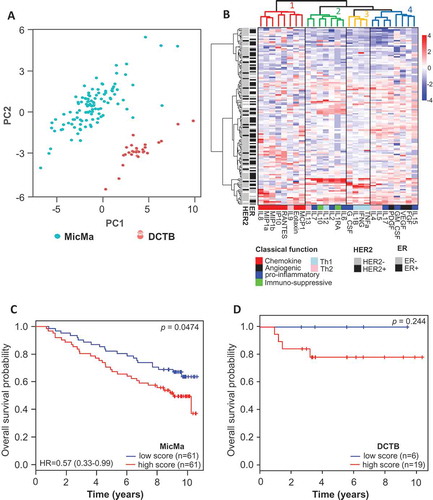
Figure 2. Serum cytokine levels and clinicopathological parameters.
(A & B) Boxplots represent the average serum levels of IL17 (log pg/mL) in ER positive (ER pos, gray) and ER negative (ER neg, white) tumors in the MicMa (A) and DCTB (B) cohorts. IL17 levels are significantly higher in ER negative samples. (C & D) Average PDGF serum levels (log pg/mL) are visualized using boxplot in regard to HER2 status in the MicMa (C) and the DCTB (D) cohorts. White boxes, HER2 negative samples (HER2 neg), pink boxes HER2 positive samples (HER2 pos). (E & F) Boxplots represent the average serum levels of PDGF (log pg/mL) in small (< 2cm, white) or larger (> 2cm, blue) tumors in the MicMa (E) and DCTB (F) cohorts. PDGF levels are significantly higher in the serum of patient with bigger tumors. The size 2cm was chosen as a cutoff to reflect the TNM staging of the American Cancer Society. Mann-Whitney test p-values are denoted in the bottom right of each boxplot.
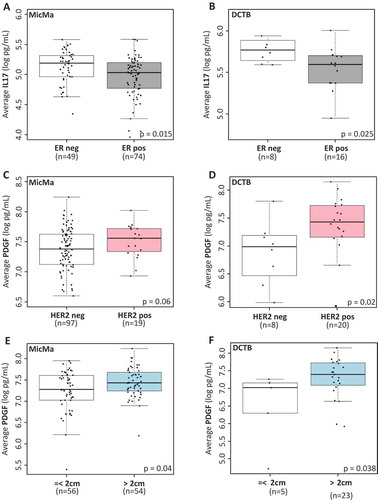
Figure 3. Cytokines serum levels and corresponding tumor mRNA expression.
(A & B) Correlation analysis for IP10 serum levels and CXCL10 mRNA expression from the bulk tumor. Dots are colored according to ER status. (C & D) Patients were divided into two groups according to the median expression of IP10. Kaplan-Meier survival curves for the high (red) and low (blue) levels of IP10 are depicted for MicMa (C) and DCTB (D). (E) Patients of the METABRIC cohort were divided into two groups according to the median mRNA levels of CXCL10. Kaplan-Meier survival curves for the high (red) and low (blue) CXCL10 are depicted. The p-values are from log-rank tests. Hazard Ratio ± 95% confidence interval are shown.
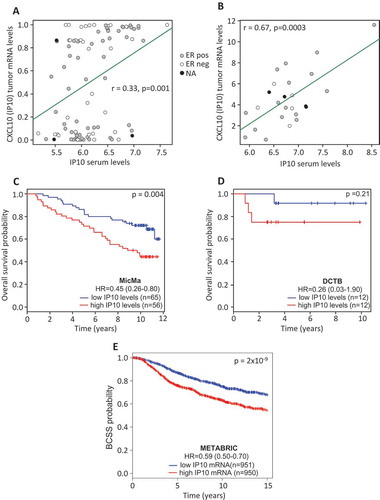
Figure 4. IP10 protein expression in breast tumors associates with high and low IP10 mRNA.
The representative IHC images of tissue sections from two pairs of breast tumors exhibiting high (Panel A, T289 and T158) and low (Panel B, T115 and T054) mRNA levels of IP10. Left sections: hematoxylin and eosin (H&E) staining for histopathological topography examination of the selected FFPE breast tissue samples. Middle sections: IHC staining with anti-CD45 specific antibodies for evaluating tumor infiltrating lymphocytes. Right sections: IHC staining with of IP10 antibodies (see Materials and Methods for details). Black arrows show the tumor cells. White arrows show the TILs. The magnification is x10 for the whole section and x40 for the insertions.
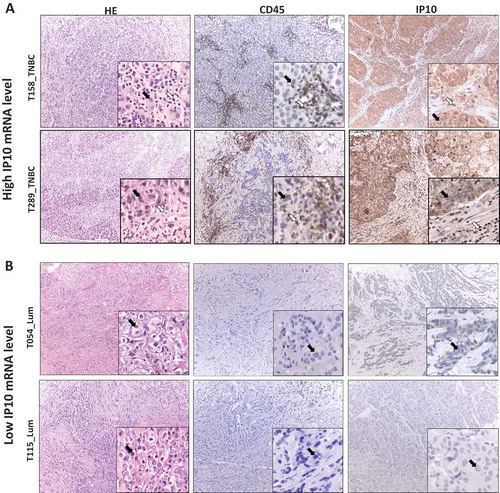
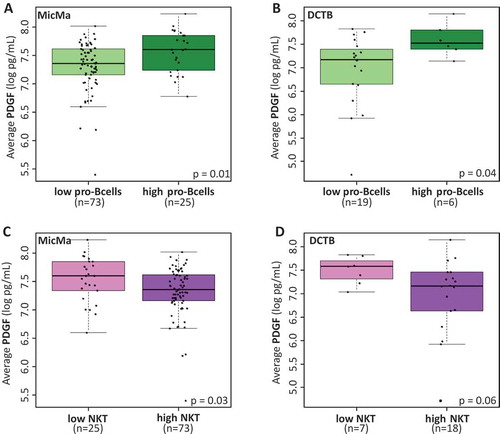
Figure 5. Cytokine levels and infiltrating immune cells.
(A & B) Boxplots represent the average serum levels of PDGF (pg/mL) in respect to low or high (highest quartile) scores for pro-B cells infiltration at the tumor site in the MicMa (A) and DCTB (B) cohorts. PDGF levels are significantly higher in the serum of patient with higher pro-B cells scores. (C & D) Boxplots of serum PDGF levels according to low (lowest quartile) and high scores for natural killer T cells (NKT) infiltration at the tumor site in the MicMa (C) and DCTB (D) cohorts. Mann-Whitney test p-values are denoted in the bottom right of each boxplot.