Figures & data
Table 1. Clinical characteristics of HCC patients in present study.
Figure 1. Isolation and purification of CD8+ T cells from HCC patients. (a) Flow chart of study design. (b) Representative immunohistochemistry staining images of CD3 and CD8 for HCC and peritumoral biopsies from patient 2129. (c) Representative flow cytometry plots of CD8+ T cells collected from different tissue origins after MACs purification.
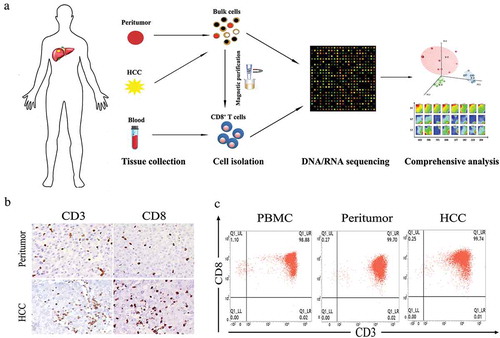
Figure 2. Genomic and transcriptomic landscapes of CD8+ T cells from different origins in HCC patients. (a and b) Circos plots of somatic SNVs and CNVs. Somatic SNVs and CNVs identified in CD8+T cells from tumor and peritumor tissues of all the eight patients were shown. The outermost ring shows the chromosome location. Black spots indicate somatic mutations, blue/red lines represent somatic deletions/duplications respectively. (c) The X axis represents the fold changes of gene expression between peritumor-derived CD8+ T cells versus PBMC-derived CD8+ T cells while the Y axis represents the fold changes between CD8+ TILs versus peritumor-derived CD8+ T cells. Genes significantly differentially expressed (adjusted P < 0.05) in both comparisons were colored with red, and genes only showed significant different expression in either CD8+ TILs vs peritumor-derived CD8+ T cells or peritumor-derived CD8+ T cells vs PBMC-derived CD8+ T cells were colored with blue and golden respectively. Other genes were colored with grey. (d) PID pathway analysis of DE genes. The outline color of each node represents the normalized significance for comparison between peritumor-derived CD8+ T cells and PBMC-derived CD8+ T cells while the inner color represents that of comparison between CD8+ TILs and peritumor-derived CD8+ T cells. Nodes are connected if the genes within two pathways were significantly overlapped (Fisher’s exact test P < 0.05). (e) Heatmap of normalized FPKM of DE genes within IL-12 mediated signal pathway.
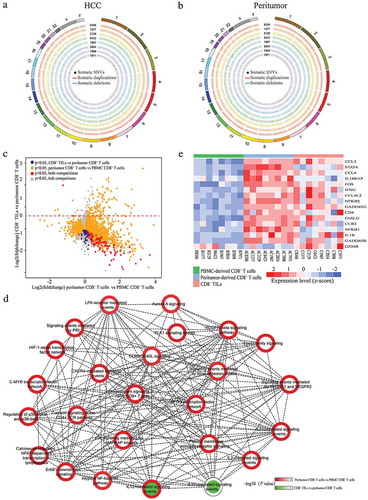
Figure 3. PCA analysis on transcription profiles of CD8+ T cells. (a) The left subplot showed the distribution of CD8+ T cells from different tissue origins according to the first three PCs. Blue dots represent PBMC-derived CD8+ T cells, green dots represent peritumor-derived CD8+ T cells and red dots represent CD8+ TILs. The right subplot showed the relationship between tissue origin of CD8+ T cells and the three PCs, the significance was examined by one-way ANOVA. (b) Heatmap of normalized FPKM of genes that most correlated to PC1 and PC3. For better visualization, only top ten most correlated genes were shown in left subplot. Additionally, histone genes, HSPs and cell proliferation regulator genes positively correlated to PC3 were also shown in the right subplot. (c) The left subplot showed PC3 score of peritumor-derived CD8+ T cells (green) and PBMC-derived CD8+ T cells (red) from each patient. The right subplot displayed the correlation between PC1/PC3 scores and expression of known signatures of CD8+ T cell subtypes from HCC patients.Citation13 Spearman’s rank correlation was performed and significant correlations (P < 0.05) were colored according to their correlation coefficient.
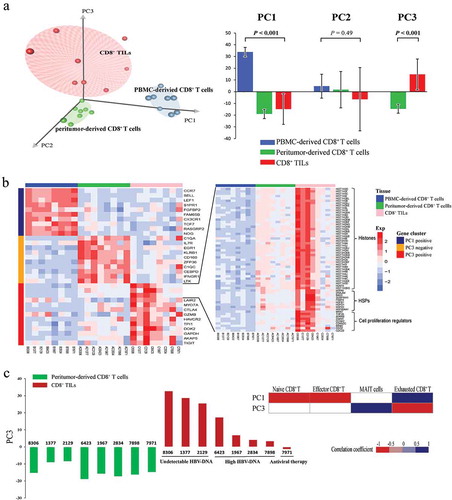
Figure 4. Transcriptional similarity and heterogeneity of CD8+ T cells. (a) SOM analysis results showing the expression pattern of each sample. Grey rectangles indicate significantly upregulated spots for each sample. (b) Sample clustering according to all the metagenes. (c) Distribution of all identified significantly regulated spots. (d) Sample level enrichment scores of each spot.
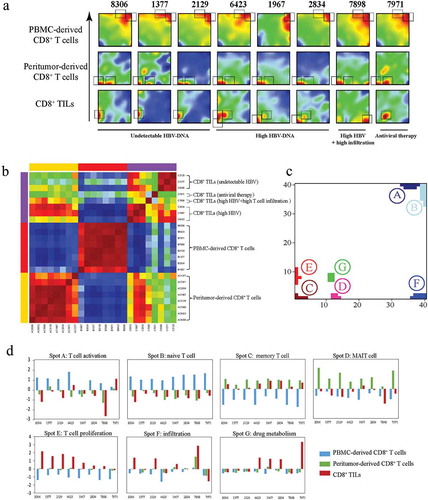
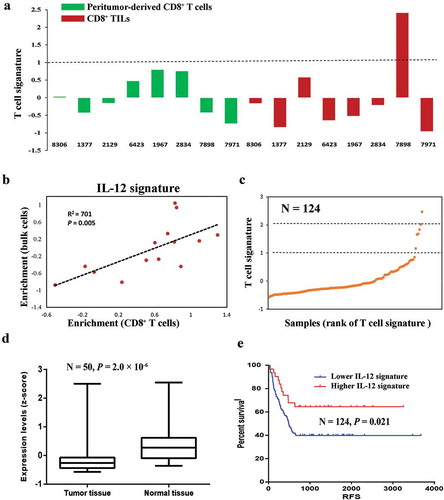
Figure 5. Downregulation of IL12-mediated signal events is associated with worse clinical outcome. (a) T cell signature enrichment of peritumor-derived CD8+ T cells (green) and CD8+ TILs cells (red) from each patient using expression profiles of bulk cells. (b) Correlation of IL-12 signature enrichment between CD8+ T cells and corresponding bulk cells. P value and coefficient of correlation were calculated using spearman’s rank correlation. (c) Scatter plot of T cell signature enrichment of TCGA samples included in survival analysis (N = 124). (d) Expression levels of IL-12 signature in HCC tissues and paired peritumor tissues from TCGA data set (N = 50). P values were evaluated by Wilcoxon matched-pairs singed rank test. (e) Kaplan–Meier plot of HCC patients stratified by IL-12 signature expression levels (N = 124). Patients expressing higher levels (higher than 75th percentile) of IL-12 signature had better disease-free survival than other patients (log-rank P = 0.021).