Figures & data
Figure 1. CD28H is highly expressed on human TRM cells. (a) Expressions of CD28H in CD8 + T cells from human peripheral blood and small intestine. Data shown are gated on CD3 + CD8 + cells. (b) CD28H expression in TRM cells from human lung. CD8 + T cells in human lung were further stained for CD69 and CD103 to identify TRM cells. The percentages of CD28H + T cells in the subsets of non-TRM (CD103-CD69+) and TRM (CD103 + CD69+) were indicated. (c) Expressions of CD69 and CD103 in CD8 + T cells from human spleen. The MFI of CD28H and the percentages of CD28H + in the subsets of CD103-CD69+, CD103 + CD69+, CD103 + CD69-, and CD103-CD69-.
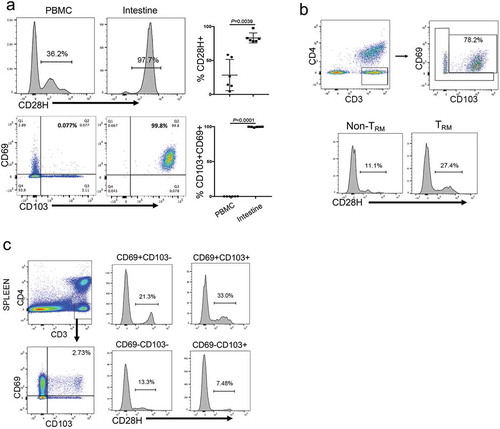
Figure 2. IL-15 and TGF-β promote CD28H expression in TRM cells. (a) Purified naïve human T cells were labeled with CFSE and cultured with IL-2 or IL7/IL-15. The expression of CD28H and cell division (CFSE) on Day 8 and 15 were detected by flow cytometry. (b) CFSE-labeled human T cells were stimulated with CD3 mAb or IL-15, with or without TGF-β. CD28H expression on proliferating CD8 + T cells (CFSElow) was shown. (c-e) Human CD8 + T cells were stimulated with IL-15, with the presence or absence of TGF-β. (c) The expressions of CD69 and CD103 on T cells were examined. (d) The percentages and MFI of CD28H expression in each subset were determined. (e) The MFI and percentages of CD28H expression in TRM subset (CD69 + CD103+) were compared between these two culture conditions. Data were collected from five independent experiments. Data showed mean ± SD and were analyzed by F-test (MFI of CD28H) and Student’s t-test (percentage of CD28H+). ****P < 0.0001, ***P < 0.001, **P < 0.01, *P < 0.05.
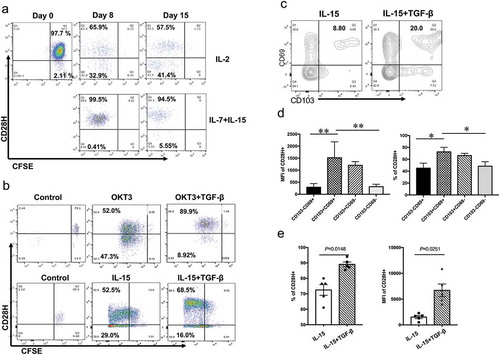
Figure 3. CD28H-positive CD8 + TILs are less differentiated antigen-experienced T cells. (a) T cells from peripheral blood and pancreatic cancer were stained for CD28H. The percentages of CD28H-expressing cells in both CD4 + and CD8 + T cell subsets were indicated. (b) The percentages of CD28H-expressing cells in CD8 + TILs from different cancer types, including PDAC, glioma, and melanoma. (c) TILs and PBMCs from different patients with PDAC were stained for CD3, CD4 and CD28H, followed with staining for CD45RO, CD45RA, or ICOS. Data shown were gated on CD3 + CD8 + T cells. (d) The expression of CD57, KLRG1 and CCR7 against CD28H in human CD8 + TILs. (e) Upon stimulation by CD3 and CD28 microbeads, TILs were stained for CD3, CD8 and CD28H, followed with intracellular staining of different cytokines as indicated. Data shown were gated on CD3 + CD8 + T cells, and further divided into two subsets based on CD28H expression. (f) TILs from different patients with PDAC were stained for CD3, CD4 and CD28H, followed with intracellular staining of perforin or Granzyme B. Data shown were gated on CD3 + CD8 + T cells, and further divided into two subsets based on CD28H expression.
Figure 4. CD28H expression identifies tumor-infiltrating lymphocytes (TILs) with TRM phenotype. (a) CD8 + TILs from pancreatic cancer were stained for CD69 and CD103 to classify into two populations: TRM and non-TRM; CD28H expression in these two populations was compared. (b) TILs were stained for CD3 and CD4 to identify CD8 + TILs, and TILs were further divided into two subsets based on CD28H expression; The percentages of TRM cells (CD103+ CD69+) in each group were indicated. (c) Plot of frequencies of CD28H-expressing T cells with those of TRM cells in pancreatic cancer. (d) Correlation analysis between the expression of CD103, CD69 and TMIGD2 (encoding CD28H) genes in pancreatic cancer patients from the TCGA cohort (n = 177 patients; r = Pearson’s correlation coefficient). Data showed mean ± SD and were analyzed by Student’s t-test. **P < 0.01.
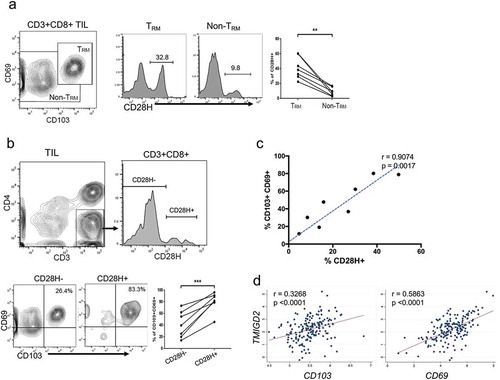
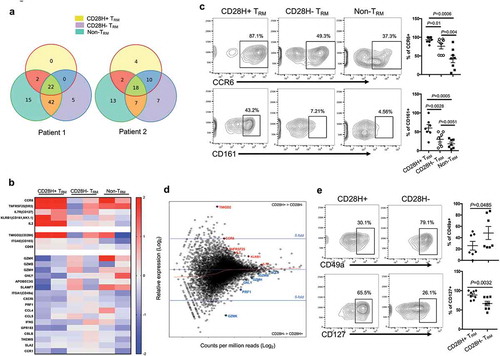
Figure 5. Characterizing CD28H + TRM cells in human TILs. (a, b, d) CD8 + TILs from human pancreatic cancer were sorted into three different groups based on the expression of CD28H, CD69 and CD103; RNAseq was performed. TCR subtype overlapping (a) and relative expression of the core T cell function genes (b) in three different CD8 + T cell subsets. (c) CCR6 and CD161 expressions in three different T cell subsets from different cancer patients. (d) MAPlot of average expression of genes in CD28H + vs CD28H- TRM cells with select genes highlighted. (e) The expressions of CD49a and CD127 in the two different TRM subsets from different cancer patients.