Figures & data
Figure 1. Schweinfurthins reduce viability of human and murine melanoma cells in vitro. Human melanoma cell lines UACC-62 (a), UACC-903 (b), and UACC-257 (c) and murine melanoma cell line B16.F10 (d) were treated with varying concentrations of the schweinfurthin analogs TTI-3114 and TTI-4242 for 48 hours. The viability of cells was measured by MTT assay. Data represent mean ± SEM.
Figure 2. Schweinfurthins induce expression of surface calreticulin. B16.F10 cells were cultured with increasing concentrations of TTI-4242, TTI-3114 or DMSO control for 24 hours. Surface calretuculin was measured by flow cytometry. (a) Representative flow cytometry dot plots showing cell viability as measured by 7AAD staining from samples treated with 125 nM schweinfurthin or vehicle control. Numbers represent the percentage of live cells from single cell gate. (b) Representative flow cytometry histograms from samples treated with 125 nM schweinfurthin or vehicle control. (c-d) Points represent 3 replicate concentrations ± SEM. Black dot represents calreticulin surface staining on cells treated only with vehicle. The results are representative of two independent experiments. Significant differences between TTI-3114 and TTI-4242 were determined by Student’s t test and are shown for values that are * p < 0.05, ** p < 0.01.
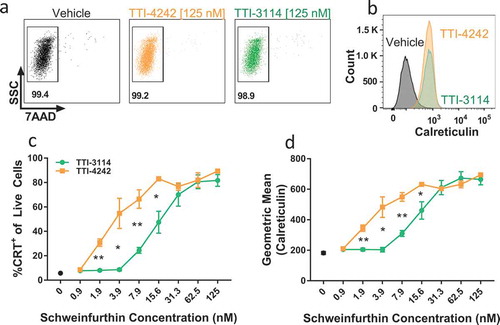
Figure 3. TTI-4242 improves tumor control in mice treated with αPD-1 therapy. (a) Experimental scheme; B16.F10 tumor-bearing mice received 200μg αPD-1 twice a week for three weeks and/or schweinfurthin (30 mg/kg TTI-4242) for five consecutive days. Control mice received 200μg rat IgG or an equivalent volume of vehicle. Once tumors became palpable (~ 20mm3), mice were treated with (b) IgG and vehicle, (c) αPD-1 and vehicle, (d) IgG and TTI-4242, (e) αPD-1 and TTI-4242. Days 10 and 20 are indicated with long- and short-dashed lines. N = 6–9/group; p values determined by mixed linear models and shown for pairwise comparisons to αPD-1 + TTI-4242. (f) Kaplan-meier survival analysis. Arrow indicates the day of challenge (day 42). N = 6–9/group; p values determined by log rank test; pairwise comparisons between αPD-1 + TTI-4242 and all other groups: ** p < 0.01. (g) The percentage of mice tumor-free (no palpable or visually apparent tumor) in each treatment group. The experiment was terminated at 100 days post treatment initiation at which point all surviving mice were tumor free.
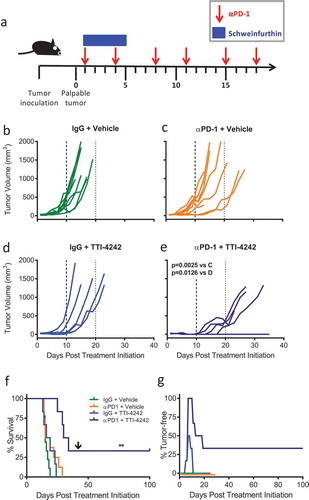
Figure 4. TTI-3114 in combination with αPD-1 delays tumor growth. Mice were treated according to the schedule in ) using TTI-3114 (20 mg/kg). Once tumors became palpable (~ 20mm3), mice were treated with (a) IgG and vehicle, (b) αPD-1 and vehicle, (c) IgG and TTI-4242, (d) αPD-1 and TTI-4242. Days 10 and 20 are indicated with long- and short-dashed lines. N = 6–9/group; p values determined by mixed linear models and shown for pairwise comparisons to αPD-1 + TTI-3114. (e) Kaplan-meier survival analysis. Arrow indicates the day of challenge (day 39). N = 6–9/group; p values determined by log rank test; pairwise comparisons between αPD-1 + TTI-4242 and all other groups: ** p < 0.01. (f) The percentage of mice tumor-free (no palpable or visually apparent tumor) in each treatment group. The experiment was terminated at 100 days post treatment initiation at which point all surviving mice were tumor free.
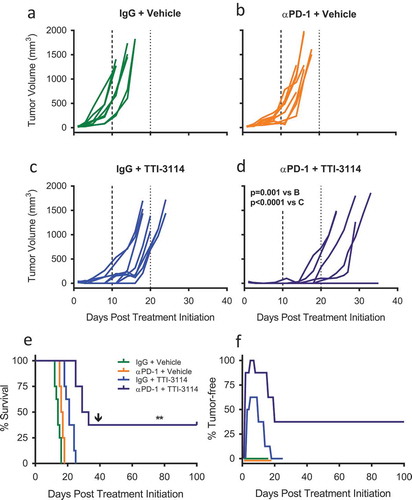
Figure 5. TTI-3114 promotes histological regression of B16.F10 tumors. Mice were treated as described in ). (a) Tumor size was determined at days 1 and 6 of treatment. Data are representative of 3 independent experiments. (b-e) Representative images from H&E stained sections of formalin fixed tumors (b-d) or a regressed lesion (e) are shown. (b, c) Tumors from mice treated with vehicle, with or without αPD-1, show sheets of pleomorphic melanocytes characteristic for melanoma. (d) Representative image of residual tumor from a mouse treated with TTI-3114 alone. (e) Representative image of mice treated with αPD-1 + TTI-3114 having no detectable tumor. Magnification 10x, scale bar represents 100 μm, T = tumor.
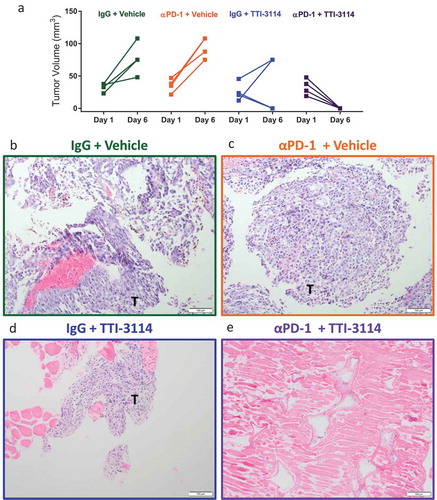
Figure 6. Schweinfurthins skew splenic immune cell subsets. Mice were treated for 5 days according to the schedule in ). On day 6, spleens were harvested and processed for flow cytometry analysis. Samples were gated on CD45+ 7AAD− cells to show percentage of (a) CD3+, (b) CD19+ and (c) NK1.1+CD3− (d) CD11c+ cells and (e) CD11b+ cells. Data represent mean ± SEM; N = 3–5/group; p values determined by one way ANOVA with Tukey’s multiple comparisons post-test: * p < 0.05, ** p < 0.01, *** p < 0.001.
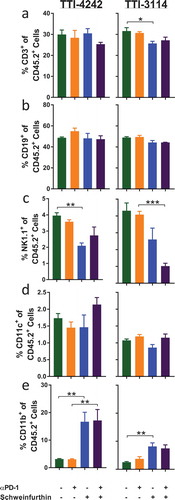
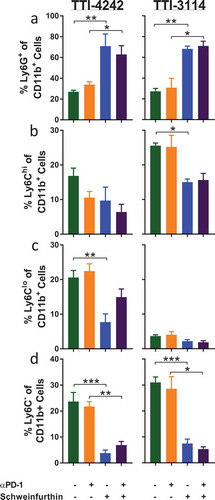
Figure 7. Schweinfurthins skew splenic myeloid cell subsets. Cells from were further gated on CD45+ 7AAD− CD11b+ cells to show percentage of (a) Ly6G+, (b) Ly6G−Ly6Chi, (c) Ly6G−Ly6Clo and (d) Ly6G−Ly6C− cells. Data represent mean ± SEM; N = 3–5/group; p values determined by one way ANOVA with Tukey’s multiple comparisons post-test: * p < 0.05, ** p < 0.01, *** p < 0.001.