Figures & data
Figure 1. Comparison of PD-L2 expression level in CGGA and TCGA cohorts with different WHO grades (a, c) and IDH status (b, d). PD-L2 was significantly increased in GRADE IV and IDH-wildtype gliomas in CGGA and TCGA data set. Photographs of immunohistochemical staining of PD-L2 in different grades of gliomas. Positive cells are stained brown. (e) Diffuse astrocytoma (WHO grade II). (f) Anaplastic astrocytoma (WHO grade III). (g) Glioblastoma multiforme (WHO grade IV). Magnification, x200. *, **, ***, and **** indicate p < 0.05, p < 0.01, p < 0.001 and p < 0.0001, respectively.
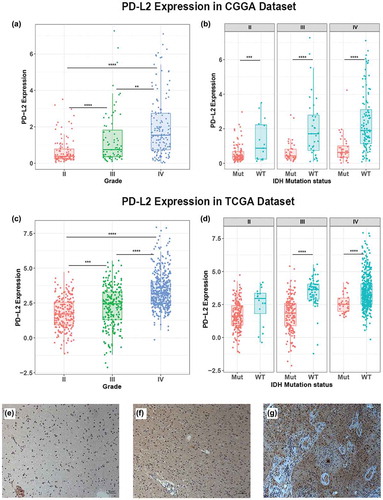
Figure 2. Comparison of PD-L2 expression level in CGGA and TCGA cohorts with different TCGA molecular subtypes (a, c), PD-L2 was significantly increased in mesenchymal subtype (p < 0.0001). ROC curves exhibited highly sensitivity in predicting mesenchymal subtype (b, d). Receiver operating characteristic (ROC) curve for mesenchymal subtype prediction in CGGA and TCGA datasets. ROC curve analysis showed that PD-L2 had highly sensitivity and specificity to predict mesenchymal subtype in CGGA and TCGA database. Area under curve(AUC) was 0.903 and 0.816, respectively.
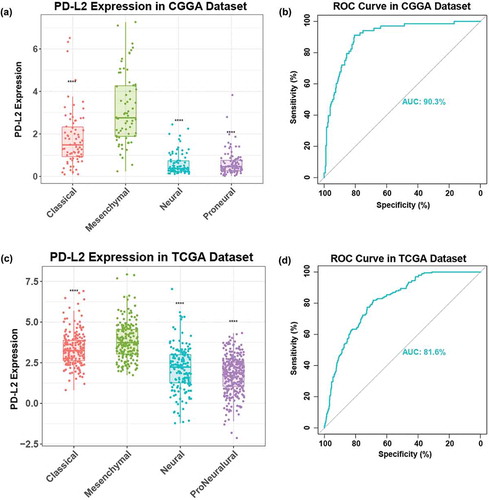
Figure 3. The biology function of PD-L2 positively related genes in CGGA and TCGA cohorts. The biological functions related with immune response, T cell proliferation, defense response to virus, cytokine secretion, NF-kappaB signaling and cellular response to mechanical stimulus were significantly positively correlated with PD-L2 expression (p < 0.05).
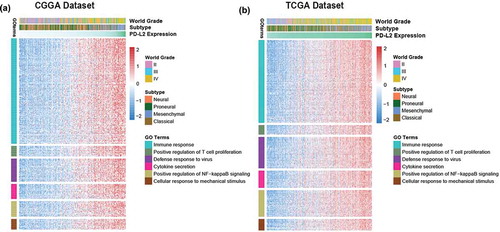
Figure 4. PD-L2 related inflammation activities in CGGA and TCGA cohorts. In pie charts, positive correlations are displayed in green and negative correlations in red. Color intensity and the size of the circle are proportional to the correlation coefficients.
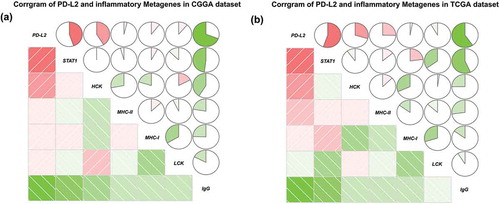
Figure 5. The PD-L2 survival curves of glioma, LGG and GBM in CGGA and TCGA cohorts. Kaplan–Meier survival analysis showed that high expression of PD-L2 conferred a significantly worse prognosis in glioma, LGG and GBM patients, respectively.
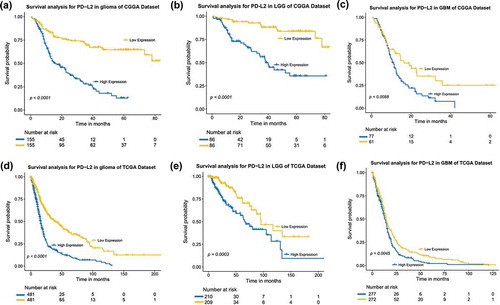
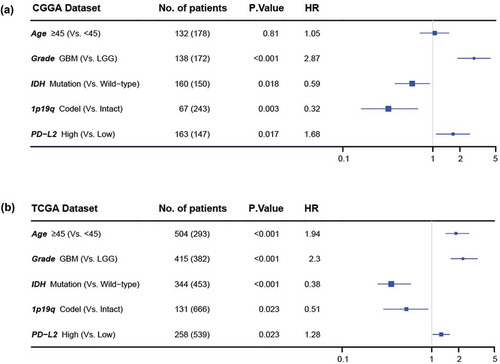
Figure 6. Forest plot of hazard ratios for overall survival assessed by PD-L2 expression and clinicopathological factors. PD-L2 expression was an independent prognostic factor after adjusting age, grade, IDH status and 1p19q status in TCGA and CGGA datasets.