Figures & data
Figure 1. Density of tumor-infiltrating CD3+ T cells in meGCTs a, Representative IHC images for CD3+ T cell staining in primary meGCT samples. The density of T cells was recorded as the number of positive cells per unit of tissue surface area. Nuclei were counterstained with hematoxylin (blue). Original magnification, x20. Scale bar, 30 µm. b, Distribution of tumor-infiltrating CD3+ T cells in meGCTs. c, Density of CD3+ T cells in the nest and septa tumor regions of the various meGCT subtypes. d, Box plot of the CD3+ T-cell density in the nest region according to the tumor location. e, Distribution of tumor-infiltrating CD3+ T cells in meGCTs according to tumor location. f, Box plot of the CD3+ T-cell density in the nest region according to age at diagnosis. g, Distribution of tumor-infiltrating CD3+ T cells in meGCT patients according to tumor location and age at diagnosis. In D and F, the boxes show the 25th to 75th percentile, the horizontal line inside the box represents the median, the whiskers extend to the most extreme data point, which is no more than 1.5 times the interquartile range from the box, and the circles are individual samples. S, seminoma; D, dysgerminoma; YS, yolk sac tumors; T, teratoma; G, gonadoblastoma; EC, embryonal carcinoma; C, choriocarcinoma. *p < 0.05. **p < 0.001.
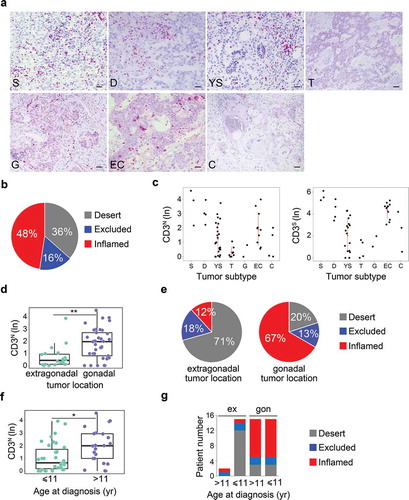
Figure 2. Density of tumor-infiltrating CD3+ T cells in mixed meGCTs a, Representative IHC images for density of CD3+ T cells in primary mixed meGCT samples. CD3+ T cells (red) are differently distributed in mixed meGCT subtypes. Nuclei were counterstained with hematoxylin (blue). Original magnification, x10. Scale bar, 30 µm. b, Distribution of tumor-infiltrating CD3+ T cells in mixed meGCTs. The immune phenotypes are indicated as follows: immune inflamed, immune-excluded, and immune desert in red, blue and gray, respectively. S, seminoma; D, dysgerminoma; YS, yolk sac tumors; T, teratoma; EC, embryonal carcinoma; C, choriocarcinoma.
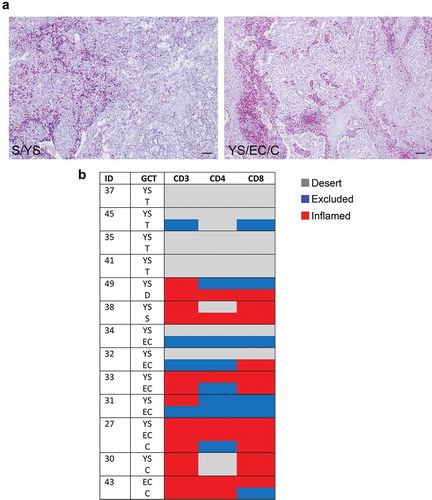
Figure 3. Density of tumor-infiltrating CD4+ and CD8+ T-cell subsets in meGCTs a. Representative IHC images for CD4+ and CD8+ T-cell staining in primary meGCT samples. T-cell subsets are in red. Nuclei were counterstained with hematoxylin (blue). Original magnification, x20. Scale bar, 30 µm. b, Distribution of CD4+ and CD8+ T cells in nest regions of meGCT subtypes. c and d, Box plots of CD4+ and CD8+ T cells in nest regions according to the tumor location and age at diagnosis, respectively. e, Distribution of tumor-infiltrating CD4+ and CD8+ T cells in meGCT patients according to tumor location and age at diagnosis. S, seminoma; D, dysgerminoma; YS, yolk sac tumors; T, teratoma; G, gonadoblastoma; EC, embryonal carcinoma; C, choriocarcinoma. *p < 0.05. **p < 0.001.
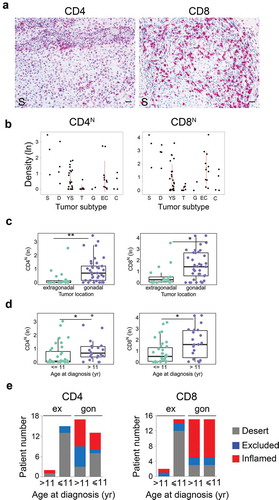
Figure 4. Density of FOXP3+, PD-1+ and PD-L1+ cells in meGCTs a, Representative IHC images of CD4 and FOXP3 double staining in primary meGCT samples visualized with diaminobenzidine (brown) and Fast Red (red), respectively. Red, black and green arrows indicate CD4+ cells, FOXP3+ cells and CD4+/FOXP3+ Tregs, respectively. Original magnification, x60. Scale bar, 30 µm. b, Distribution of TIL subsets in FOXP3-expressing meGCTs. c, Representative examples of PD-1+ cell staining in a meGCT samples. Original magnification, x20. Scale bar, 30 µm. d, Distribution of TIL subsets in PD-1-expressing meGCTs. e, Representative IHC images for PD-L1+ cell staining in primary meGCT samples. Black and red arrows indicate PD-L1+ tumor cells and tumor-infiltrating PD-L1+ lymphocytes, respectively. Original magnification, x20. Scale bar, 30 µm. f, Distribution of tumor-infiltrating T-cell subsets in PD-L1-expressing meGCTs. S, seminoma; D, dysgerminoma; YS, yolk sac tumors; EC, embryonal carcinoma; C, choriocarcinoma.
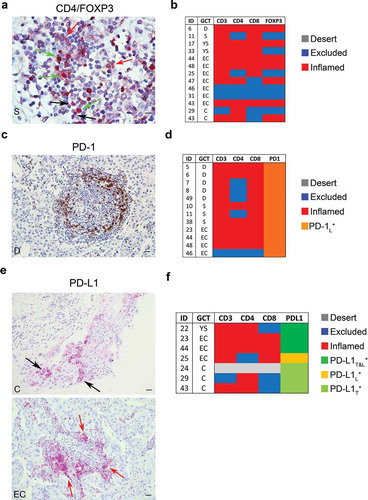
Figure 5. Density of tumor-infiltrating T cell subsets and tumor PD-L1 in primary and relapsed meGCTs a, Representative IHC images of CD3+ T cell staining in primary (P) and relapsed (R) meGCT samples. Original magnification, x20. Scale bar, 30 µm. b, Distribution of TIL subsets and PD-L1 expression in primary and relapsed meGCTs. T, teratoma, YS, yolk sac tumors; EC, embryonal carcinoma; C, choriocarcinoma.
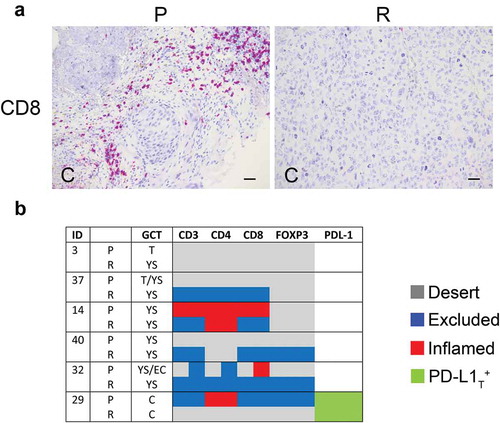
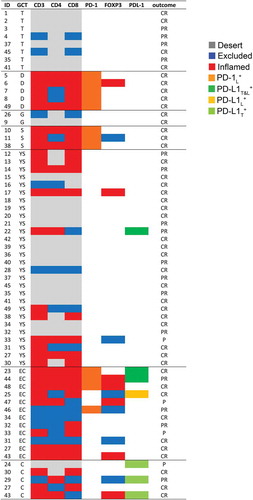
Figure 6. Immune profiling of tumor-infiltrating T cells and expression of PD-1 and PD-L1 in meGCs. Distribution of TIL subsets and expression of PD-1 and PD-L1 cells in meGCTs. CR: complete response; PR: partial response; P: progression. S, seminoma; D, dysgerminoma; YS, yolk sac tumors; T, teratoma; G, gonadoblastoma; EC, embryonal carcinoma; C, choriocarcinoma.