Figures & data
Figure 1. Design of IL-12 and TCR vectors and in vitro validation.
(a) Diagrams representing the molecular structure of the retroviral vectors. IRES; internal ribosome entry site, LTR; long terminal repeat, GFP; green fluorescent protein, NFAT; nuclear factor activated T cells. (b) Anti-CD3/CD28-activated splenocytes were transduced with the Tet-IL-12 construct (Tet-IL-12) or vector control (VC) construct containing GFP only (Tet-GFP), and treated with Dox (1 µg/ml) overnight or left untreated. Representative flow cytometry plots showing the expression of Q8 and GFP in transduced T cells demonstrating the transduction efficacy and the level of induction in the presence and absence of Dox. Representative histogram overlay showing intracellular IL-12 staining in GFP-positive (induced) and GFP-negative (non-induced) cells after 4hrs treatment with BFA. The experiments were done at least 3 times with similar results. (c) Anti-CD3/CD28-activated splenocytes were transduced with NFAT-IL-12 construct or mock-transduced and analyzed by flow cytometry for GFP expression the following day. (d) Representative flow cytometry plots depicting intracellular IFNγ and TNFα staining of T cells transduced with NP-specific F5-TCR and either Tet-IL-12 (TTCR+iIL-12) or Tet-GFP vector control (TTCR+iGFP), and stimulated with EL4 (control) or EL4-NP tumor cells expressing the cognate antigen for 4hrs in the presence and absence of Dox. Dot plots show live-gated TCR-expressing cells (CD19+). Data shown represents at least 3 independent experiments. (e) Measurements of IL-12 secretion in culture supernatant of transduced T cells by enzyme-linked immunosorbent assay (ELISA). Graph shows mean ± SEM of duplicate values from two experiments. (f) Mean of body weight measurements over time post transfer of 5 × 10⁵ TcIL-12 or Tmock transduced cells into sublethally irradiated (4Gy) recipient mice; baseline is 100%. n = 3 mice per group. (g)Mean of body weight measurements over time of mice receiving 5 × 10⁵ Tet-IL-12 or NFAT-IL-12 transduced T cells. Mice received Tet-IL-12 transduced T cells were split into two cohorts: one received Dox (2mg/ml) in drinking water (+ Dox) and the other cohort left untreated (-Dox). n = 5 mice per group. (h) Kinetics of transient IL-12 induction in vivo. C57BL/6 mice (Thy1.2+) were sublethally irradiated (4Gy) and injected intravenously with 5 × 10⁵ Tet-IL-12 transduced T cells (Thy1.1+). On day 4 post T cell transfer, mice were split into two groups, one group received Dox-containing water (2mg/ml) for 3 consecutive days and the other group left untreated. Blood samples were obtained at 24hrs, 48hrs and 72hrs following Dox administration, and 24hrs following Dox withdrawal. Representative flow cytometry plots showing the levels of GFP expression. Cells were pre-gated on PI- singlet Thy1.1+ lymphocytes. n = 4 mice (-Dox); n = 6 mice (+ Dox) (top). Mean of body weight measurements over time showing lack of toxicity with temporal Dox induction post transfer of 5 × 10⁵ Tet-IL-12 transduced cells into sublethally irradiated (4Gy) recipient mice. Mice received Tet-IL-12 transduced T cells were split into two cohorts: one received Dox (2mg/ml) in drinking water (+ Dox) for 3 days and the other cohort left untreated (-Dox). Graph shows mean ± SEM. n = 5 mice per group (bottom).
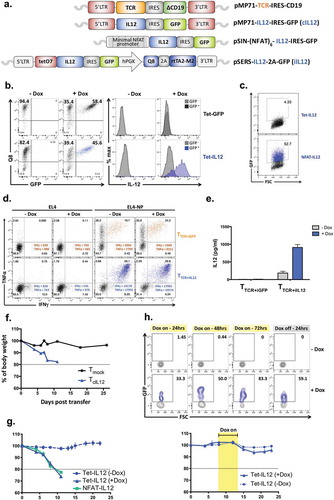
Figure 2. Temporal induction of IL-12 in TCR-engineered T cells increases the numbers of T cells in the tumor and prevents PD-1 upregulation.
(a) Experimental setup. C57BL/6 female mice (Thy1.2+) were inoculated subcutaneously with 5 × 10⁵ B16 melanoma cells. 10 days later, mice were sublethally irradiated with 4Gy TBI 3-4hrs prior receiving intravenous injection of 2 × 10⁶ T cells (Thy1.1+) that were transduced with TRP2-TCR (TTCR), Tet-IL-12 (TiIL-12), TRP2-TCR + Tet-IL-12 (TTCR+iIL-12), or mock-transduced T cells (Tmock). All mice received Dox (2mg/ml) in drinking water 2–3 days prior receiving T cell infusion and kept on Dox water for another 3 days. Tumors, spleens and lymph nodes were harvested on day 5 after the adoptive transfer and analyzed by flow cytometry. (b) Representative dot plots showing the percentage of transferred cells (Thy1.1+) (top) and pooled summary data (bottom). Cells were pre-gated on live-singlet lymphocytes. Symbols represent individual mice and bars indicate group averages. P values: TTCR versus TTCR+iIL-12 transduced cells and TiIL-12 versus TTCR+iIL-12 transduced cells; p < 0.0001. (c) Relative accumulation of TCR-expressing cells (CD19+) in tumor, spleen and draining lymph nodes (DLN) 5 days post T cell transfer. Cells were pre-gated on live-singlet transferred Thy1.1+ T cells. Data shown are cumulative results from at least two independent experiments. P values for the frequency of TCR+ cells: TTCR versus pre-injection in the tumor, spleen and DLN; p > 0.05, TTCR+iIL-12 versus pre-injection in the tumor; p = 0.0010, spleen; p = 0.0020 and DLN; p = 0.0049. P values for CD19 MFI: TTCR versus TTCR+iIL-12 in the tumor; p < 0.0001, spleen and DLN; p > 0.05. Symbols represent individual mice (TTCR, n = 8 and TTCR+iIL-12, n = 11). (d) Representative flow cytometry plots depicting the percentage of TCR-expressing cells (CD19+) and mean fluorescence intensity (MFI) of CD19 within the adoptively transferred Thy1.1+ T cells. Cells were pre-gated on live-singlet lymphocytes. (e) Representative flow cytometry plots depicting PD-1 staining profile of TCR-expressing cells (Vβ3+) in the tumor which divided them into two populations: Vβ3hi PD-1lo and Vβ3lo PD-1hi T cells (top) and bar charts representing summary data pooled from two independent experiments (bottom). P values: percentage of Vβ3hi PD-1lo T cells in TTCR versus TTCR+iIL-12; p < 0.0001, percentage of Vβ3lo PD-1hi T cells in TTCR versus TTCR+iIL-12; p = 0.0011.
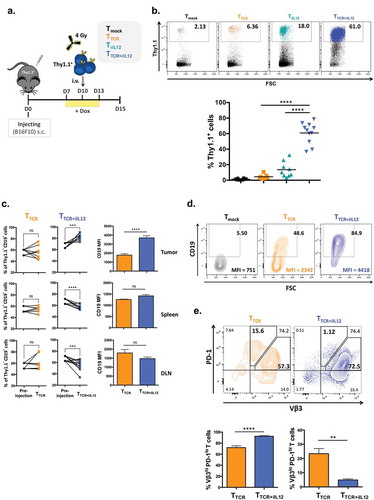
Figure 3. Transient IL-12 induction changes the myeloid cell composition of the tumor microenvironment.
C57BL/6 female mice bearing subcutaneous melanoma for 10 days were sublethally irradiated with 4Gy TBI prior to adoptive T cell transfer of Tmock, TTCR, TiIL-12 or TTCR+iIL-12 transduced T cells. All mice received Dox-containing water (2mg/ml) 2–3 days prior receiving T cell infusion and kept on Dox water for another 3 days. Tumor infiltrating cells were harvested on day 5 post T cell transfer and analyzed by flow cytometry. (a) Gating strategy. Using forward scatter (FSC) and side scatter (SSC), tumor cells (FSC/SSC high), granulocytes (SSC intermediate) and lymphocytes (FSC/SSC low) were identified. PI− singlet granulocytes were assessed for their surface expression of CD11b, CD11c, F4/80 and Gr-1 to identify different myeloid-derived cell populations including: CD11b+CD11c+; dendritic cells (DCs), CD11b+F4/80+; macrophages (MQs) and CD11b+Gr-1+ myeloid-derived suppressor cells (MDSCs), including monocytic MDSCs (Gr-1mid; MDSC-M) and granulocytic MDSCs (Gr-1hi; MDSC-G). (b) Representative dot plots showing tumor infiltrating myeloid-derived cells 5 days after the adoptive T cell transfer (left) and pooled summary data (right). Cells were pre-gated on live-singlet granulocytes. Graphs are showing mean ± SEM. P values: frequency of DCs in mice treated with TTCR versus TTCR+iIL-12; p = 0.0001, frequency of MQs in mice treated with TTCR versus TTCR+iIL-12; p = 0.0001, TTCR+iIL-12 versus TiIL-12; p = 0.0008, frequency of MDSCs in mice treated with TTCR versus TTCR+iIL-12; p = 0.0003, frequency of CD11b−Gr-1+ in mice treated with TTCR versus TTCR+iIL-12; p = 0.0001, TTCR+iIL-12 versus TiIL-12; p = 0.0432, total number of DCs in mice treated with TTCR versus TTCR+iIL-12; p = 0.0195, TTCR+iIL-12 versus TiIL-12; p = 0.0249, total number of MQs in mice treated with TTCR versus TTCR+iIL-12; p = 0.0441, TTCR+iIL-12 versus TiIL-12; p = 0.0091, total number of CD11b−Gr-1+ in mice treated with TTCR versus TTCR+iIL-12; p = 0.0031. Data shown are cumulative results of two independent experiments. Number of mice per group: Tmock, n = 10; TTCR, n = 7; TiIL-12, n = 8; TTCR+iIL-12, n = 11. (c) Identification of pDC subset infiltrating the tumor at day 5 following T cell transfer. CD11b−Gr-1+ population were analyzed for the surface expression of CD11c, B220 and MHC class II molecules (I-Ab). Representative plots showing tumor-infiltrating pDCs in mice treated with TiIL-12 and TTCR+iIL-12 cells (left) and pooled summary data for the frequency of B220+CD11clo/mid cells pre-gated on live-singlet CD11b−Gr-1+ granulocytes in mice treated with Tmock, TTCR, TiIL-12 or TTCR+iIL-12 transduced T cells (right). Graphs are showing mean ± SEM. P values: frequency of pDCs in mice treated with TTCR versus TTCR+iIL-12 and TiIL-12 versus TTCR+iIL-12; p = 0.0159, total number of pDCs in mice treated with TTCR versus TTCR+iIL-12; p = 0.015.
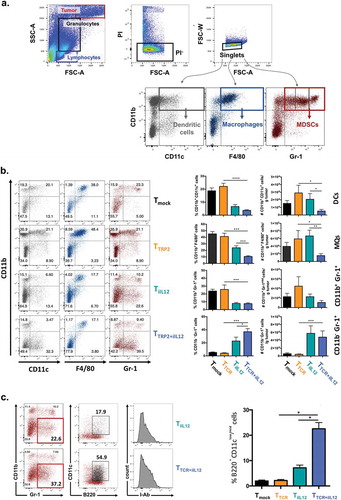
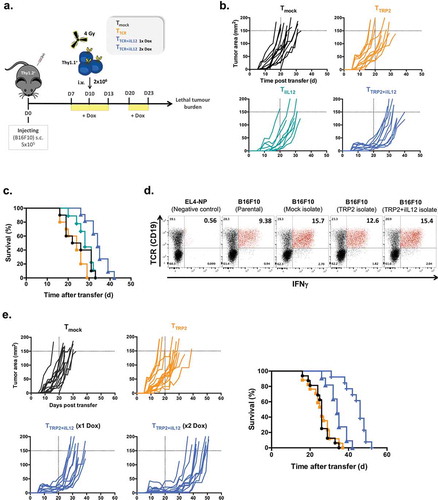
Figure 4. IL-12 overexpression in TCR-engineered T cells delay the development of lethal tumor burden in B16 melanoma-bearing mice.
(a) Experimental setup. C57BL/6 (Thy1.2+) female mice bearing 10 days B16F10 melanoma were sublethally irradiated and injected intravenously with 2 × 10⁶ transduced T cells (Thy1.1+) including TTCR, TiIL-12, TTCR+iIL-12 or Tmock cells. All mice received Dox (2mg/ml) in drinking water 2–3 days before T cell transfer and kept on Dox for another 3 days. In another set of experiments, mice that were treated with TTCR+iIL-12 cells were split into two cohorts: one group had single induction of IL-12 (at d10) and the other group had double induction of IL-12 (at d10 and d20 post tumor injection). (b) Tumor size over time post T cell transfer until mice reached lethal tumor burden. (c) Kaplan-Meyer survival plots of mice treated with TTCR, TiIL-12, TTCR+iIL-12 or Tmock cells. P values: Tmock versus TTCR or TiIL-12; p > 0.05 (ns), TTCR versus TTCR+iIL-12; p < 0.0001. Data shown in B and C are cumulative results of at least two independent experiments. Number of mice per group: Tmock, n = 10; TTCR, n = 10; TiIL-12, n = 9; TTCR+iIL-12, n = 11. (d) B16F10 tumors were re-isolated from mice treated with TTCR, TTCR+iIL-12 or Tmock cells at the time point when mice reached lethal tumor burden. The tumor cells were pre-treated overnight with IFNγ-containing medium and co-cultured with TRP2-TCR-transdcued T cells (CD19; TCR reporter marker) for 5hrs in the presence of BFA. Representative dot plots showing antigen-specific production of IFNγ by TCR-positive cells. Parental B16F10 melanoma cells and EL4-NP tumor cells were used as a positive and negative controls, respectively. Cells were pre-gated on live-singlet lymphocytes. (e) B16F10 tumor growth kinetics until mice reached lethal tumor burden (left) and Kaplan-Meyer survival plot of mice received TTCR, TTCR+iIL-12 (1x Dox; single induction), TTCR+iIL-12 (2x Dox; double induction) or Tmock transduced T cells. P values: TTCR versus TTCR+iIL-12 (1x Dox); p = 0.0002, TTCR versus TTCR+iIL-12 (2x Dox); p < 0.0001, TTCR+iIL-12 (1x Dox) versus TTCR+iIL-12 (2x Dox); p = 0.0004 (right). Data shown represent pooled data from three independent experiments. Number of mice per group: Tmock, n = 15; TTCR, n = 17; TTCR+iIL-12 (1x Dox), n = 12; TTCR+iIL-12 (2x Dox), n = 13.