
Figures & data
Figure 1. Relative expression of immune checkpoints in circulation of HD, PBC and CRC patients. RNA from PBC, CRC and HD patients were isolated and reversely transcribed into cDNA, followed by quantitative RT-PCR to assess the relative expression levels of PD-1 (a), CTLA-4 (b), TIM-3 (c), LAG-3 (d), TIGIT (e), PD-L1 (f) and VISTA (g) in circulation. All genes were normalized to β-actin.
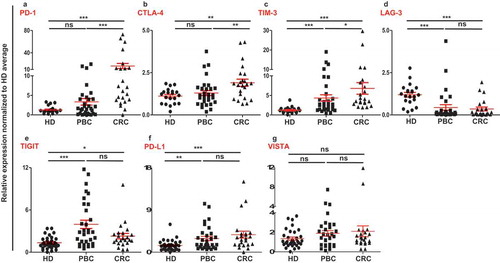
Figure 2. Relative expression of ICs/ligand in PBC and CRC patients based on their TNM staging and histological grade. Patients were classified according to their TNM and histological garde. Scatter plots of PBC (a) and CRC (c) patients of TNM stage I and II (1) compared to stage III and IV (2), and PBC (b) and CRC (d) patients of histological grade moderate and well differentiated (a) were compared to poorly differentiated (b).
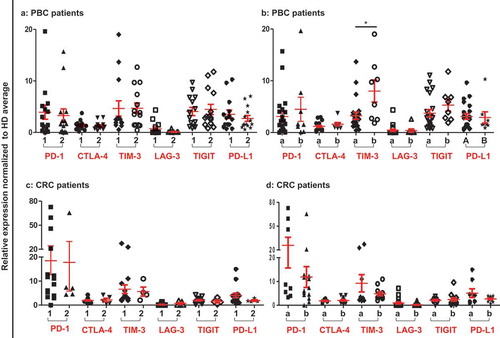
Figure 3. Relative expression of methylation/demethylation enzymes in circulation of HD, PBC and CRC patients. Scatter plots show the relative expression of DNMT3a (a), DNMT3b (b), TET2 (c), and TET3 (d) in circulation of PBC, CRC and HD patients. All genes were normalized to β-actin.
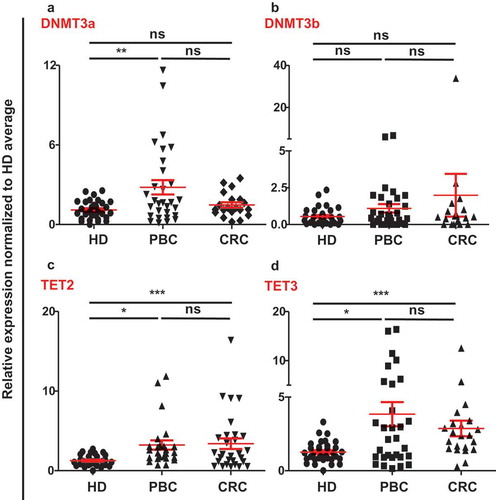
Figure 4. Analysis of CpG methylation status of ICs and PD-L1 in circulation of HD, PBC and CRC patients. Representative plots show the promoter CpG methylation status in PD-1 (a), CTLA-4 (b), TIM-3 (c), LAG-3 (d), TIGIT (e) and PD-L1 (f) in the circulation of 10 HD, 8 PBC and 12 CRC patients as analyzed by bisulfite sequencing of the gDNA. Methylation status of individual CpG motifs is shown by white (demethylation) or grey (methylation) colors.
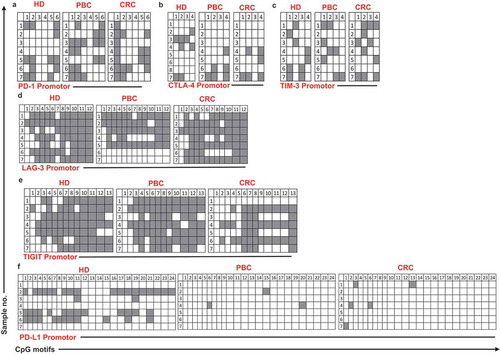
Figure 5. Overall CpG demethylation percentage of ICs and PD-L1 in HD, PBC and CRC patients. Bar plots show the average demethylation percentage of PD-1, CTLA-4, TIM-3, LAG-3, TIGIT and PD-L1 in 10 HD, 8 PBC and 12 CRC patients.
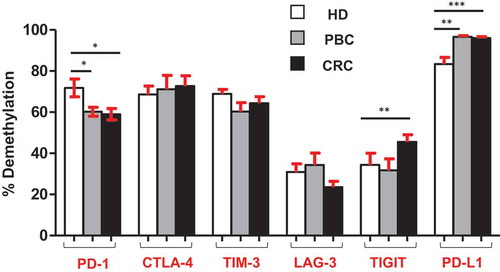
Figure 6. Comparisons of the relative expression and DNA demethylation percentage of the ICs/PD-L1 in blood, normal and tumor tissues from PBC and CRC patients. Bar plots show the relative expression of ICs/PD-L1 (a) and CRC (c) patients. Bar plots show the CpG demethylation status of the ICs/PD-L1 in blood, NT and TT of PBC (b) and CRC (d) patients.
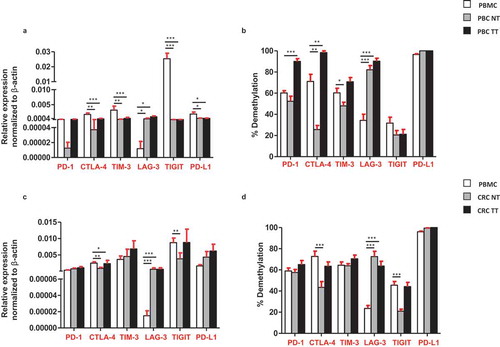
Table 1. Characteristic features of study populations.