Figures & data
Figure 1. Deficiency in Batf3 impacts on the efficacy of neoadjuvant anti-PD-1 and anti-CD137 immunotherapies. (A, B) Groups of BALB/c WT or Batf3−/- mice (n = 5/grp) were injected with 5 × 10⁴ 4T1.2 mammary carcinoma cells in the mammary fat pad. A, As indicated in the schematic, groups of mice were treated with either neoadjuvant or adjuvant anti-PD-1 and anti-CD137 mAb (100 μg/mouse of each mAb, i.p.) on days 11 and 13 (neoadjuvant groups) or days 19 and 21 (adjuvant groups) with all primary tumors resected on day 16 while control IgG (cIg) (200 μg/mouse, i.p.) was given on days 11, 13, 19 and 21. A, The Kaplan-Meier curves for overall survival of each group are shown. Data pooled from 2 experiments with significant differences between indicated groups determined by log-rank sum test with exact p values shown. B, From one experiment in (A), peripheral blood was collected from the indicated groups of mice longitudinally for flow cytometry (n = 5/grp). Gating on live CD45.2+ cells of lymphocyte morphology, the proportion of gp70 tetramer+ CD8+ TCRβ+ cells is shown. Data presented as mean + SEM. A naive mouse was also included in this experiment. Significant differences between neoadjuvant anti-PD-1+ anti-CD137 treated WT mice and Batf3−/- mice on day 16 following tumor inoculation were determined by unpaired Welch’s t-test with exact p value indicated. C-E, In a similar experimental setup as (A), groups of WT and Batf3−/- mice (n = 4–6/grp) were treated with neoadjuvant anti-PD-1 and anti-CD137 mAb (100 μg/mouse of each mAb, i.p.) or cIg (200 μg/mouse, i.p.) on days 11 and 13 and were sacrificed on day 16 and their tumors, draining lymph node (dLN) and non-draining lymph node (ndLN) collected and single cell suspensions generated for flow cytometry. Gating on live CD45.2+ cells of lymphocyte morphology, the absolute numbers of gp70 tetramer+ CD8+ TCRβ+ cells in the (C) tumor, (D) dLN and (E) ndLN are shown. Data presented as mean ± SEM. Data pooled from 2 experiments with significant differences determined by two-way ANOVA with Dunnett’s post-test analysis with exact p value shown.
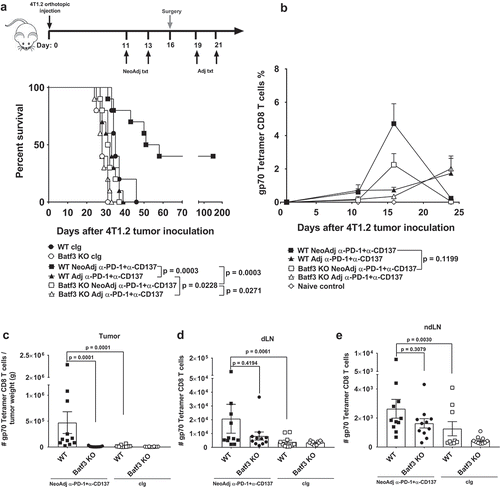
Figure 2. Type I interferon signaling is required for the efficacy of neoadjuvant anti-PD-1 and anti-CD137 immunotherapy. A, Groups of BALB/c WT mice (n = 5–6/grp) were injected with 5 × 10⁴ 4T1.2 mammary carcinoma cells in the mammary fat pad. Groups of mice were treated with either neoadjuvant or adjuvant anti-PD-1 and anti-CD137 mAb (100 μg/mouse of each mAb, i.p.) or cIg (200 μg/mouse, i.p.) with all primary tumors resected on day 16 as indicated in the schematic. In some groups, mice were additionally treated with cIg or anti-IFNAR1 (500 μg/mouse of each mAb, i.p.) on day 10, 11, 13 (neoadjuvant groups) or days 18 and 19, 21 (adjuvant groups). The Kaplan-Meier curves for overall survival of each group are shown. Significant differences between indicated groups were determined by log-rank sum test with exact p values shown. Data pooled from 2 experiments. B, Groups of BALB/c WT mice (n = 5–10/grp) were injected with 2 × 10⁴ 4T1.2 mammary carcinoma cells in the mammary fat pad. Groups of mice were treated with either neoadjuvant anti-PD-1 alone or anti-PD-1 and anti-CTLA4 mAb (250 μg/mouse of each mAb, i.p.) or cIg (500 μg/mouse, i.p.) on day 12 and 14 with all primary tumors resected on day 16. In some groups, mice were additionally treated with cIg or anti-IFNAR1 (250 μg/mouse of each mAb, i.p.) on day 10, 12, 14 and 21. The Kaplan-Meier curves for overall survival of each group are shown. Significant differences between indicated groups were determined by log-rank sum test with exact p values shown. This experiment was performed once. C, From one experiment in (A), peripheral blood was collected from the indicated groups of mice longitudinally for flow cytometry (n = 5/grp) at the indicated time point for flow cytometry. Gating on live CD45.2+ cells of lymphocyte morphology, the proportion of gp70 tetramer+ CD8+ TCRβ+ cells is shown. Data presented as mean + SEM. A naive mouse was also included for this experiment. Significant differences between cIg or anti-IFNAR1 mAb treated mice on day 16 following tumor inoculation were determined by unpaired Welch’s t-test with exact p value indicated. Data representative of 2 independent experiments.
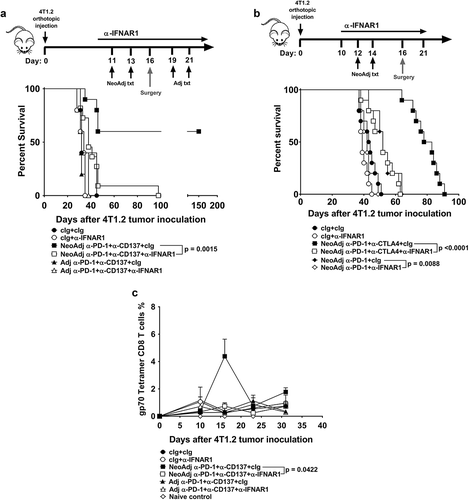
Figure 3. Decreased proportion of IFNγ or TNF producing tumor-specific T cells in tumor-bearing mice treated with neoadjuvant immunotherapy and anti-IFNAR1. In a similar experimental setup as , groups of neoadjuvant anti-PD-1 and anti-CD137 treated mice (n = 5/grp) that were additionally treated with cIg or anti-IFNAR1 mAb were sacrificed on day 16 and their lungs collected and single cell suspensions generated for flow cytometry. Gating on live CD45.2+ cells of lymphocyte morphology, the proportions of gp70 tetramer+ CD8+ TCRβ+ T cells or total CD8+ TCRβ+ T cells in lungs that were IFNγ+ (A) or TNF+ (B) are shown. Data presented as mean ± SEM. Significant differences determined by unpaired Welch’s t-test with exact p value shown. Experiment pooled from 2 independent experiments.
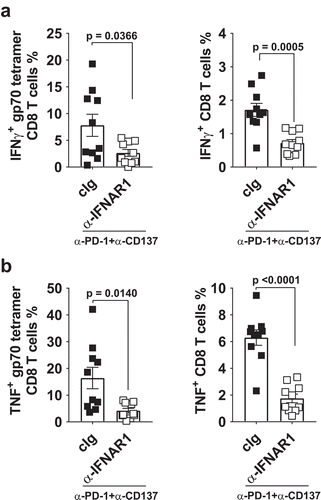
Figure 4. CD103+ DCs increased in tumor draining lymph nodes and expressed higher levels of CD86 following neoadjuvant immunotherapy. Groups of BALB/c WT mice (n = 5/grp) were injected with 5 × 10⁴ 4T1.2 mammary carcinoma cells in the mammary fat pad before treatment with either anti-PD-1+ anti-CD137 or cIg (100 μg/mouse of each mAb, i.p.) or cIg (200 μg/mouse, i.p.) on day 10 and 12. Some groups of mice were additionally treated with anti-IFNAR1 (500 μg/mouse) on day 9. Tumors, draining lymph nodes (dLN) and non-draining lymph nodes (ndLN) were harvested two days following the final antibody treatment (on day 14) and single cell suspensions generated for flow cytometry. Gating on live CD45.2+ cells, MHC-II+CD11c+CD64lo/-Ly6C− cells, the absolute numbers of CD103+CD11b− DCs in the (A) tumor, (B) dLN, and (C) ndLN are shown. The geometric mean fluorescence intensity (MFI) of CD86 on CD103+ DCs in the (D) tumor, (E) dLN, and (F) ndLN are shown. Data presented as mean ± SEM. Significant differences determined by Kruskal-Wallis test with exact p values shown. Experiment was performed once.
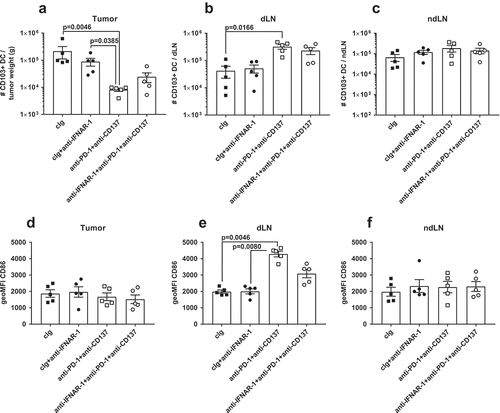
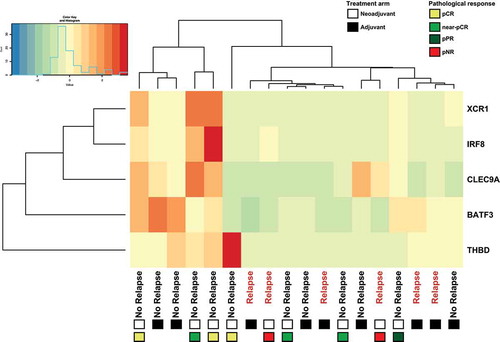
Figure 5. Patients treated with adjuvant or neoadjuvant ipilimumab plus nivolumab in OpACIN trial that relapsed displayed low expression of Batf3+ DC-associated genes. Hierarchical clustering of Batf3+ DC-associated genes including Batf3 and the 4 genes (IRF8, THBD, CLEC9A, XRC1) that are included in the Batf3+ DC score as defined byCitation13. Gene-level expression values were computed as transcripts per million (tpm) and were normalized to z-scores before clustering. Positive values (red) indicate higher expression and negative values (green/blue) indicate lower expression. Every column represents one patient of which clinical outcome is depicted, the squares below the clinical outcome indicate the treatment arm: adjuvant (black) or neoadjuvant (white) and types of pathological response for neoadjuvant-treated patients. pCR (yellow); pathological complete response, near pCR (green), pPR (blue); pathological partial response, pNR (red); pathological non-response.