
Figures & data
Table 1. Consequences of a single iteration of APOBEC-related mutagenesis on the overall hydrophobicity of the human coding genome (per in silico computation)a
Figure 1. Amino-acid distribution and relative hydrophobicity of the human coding genome after 1 and 20 APOBEC-related iterations (by in silico computation), as compared as other causes of mutagenesis.
Panel A shows changes in human coding genome overall hydrophobicity after multiple iterations of APOBEC-related mutagenesis, as computed in silico (n = 1 to 100 iterations). All nucleotides stretches (mutated or not) were included, reciprocals were not considered. Results obtained by applying the same method to alternative mutation signatures are shown for comparison purposes.Panel B and C show changes in hydrophobicity distribution after a single (B) or multiple (C) APOBEC-related mutagenesis iteration of all 6-nucleotide stretches whether or not they would be expected to be mutated; reciprocals wre not included. The figure breaks down the changes by hydrophobicity categories. There is a loss of hydrophilic amino acids (left side of the mountain graphic) and a gain of hydrophobic amino acids (right side of the mountain graphic).Panel D and E show the percentage of change of each amino acid (D) and codon stop (E) after 1 and 20 iterations of APOBEC-related mutagenesis.Amino-acid code – alanine (Ala, A), arginine (Arg, R), asparagine (Asn, N), aspartic acid (Asp, D), cysteine (Cys, C), glutamic acid (Glu, E), glutamine (Gln, Q), glycine (Gly, G), histidine (His, H), isoleucine (Ile, I), leucine (Leu, L), lysine (Lys, K), methionine (Met, M), phenylalanine (Phe, F), proline (Pro, P), serine (Ser, S), threonine (Thr, T), tryptophan (Trp, W), tyrosine (Tyr, Y), valine (Val, V), stop codon (X, *).
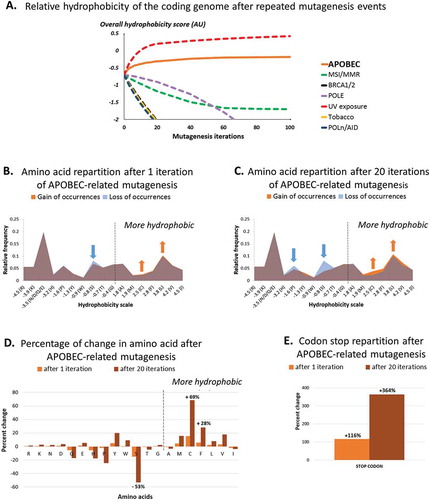
Table 2. Comparison of change in hydrophobicity of the neo-peptide library (8- to 10-mer peptides) of TCGA tumors (whole exome sequencing) with and without APOBEC-related mutagenesisa.
Figure 2. Overall change in hydrophobicity in human tumors positive for APOBEC-related mutagenesis.
Panel A. Correlation between the overall neo-peptide hydrophobicity change and the total number of APOBEC-related mutations in highly-mutated human tumors positive for APOBEC-related mutagenesis.Panels B-E. Comparison of neo-peptide hydrophobicity change in highly mutated tumors with or without APOBEC-related mutagenesis, in different subgroups of tumors (non-melanoma (B, D) and melanoma tumors (C, E)), considering the hydrophobicity scores before (B, C) or after (D, E) weighting by the mRNA-expression levels. Mean and 95% confidence intervals are represented in bold bars.
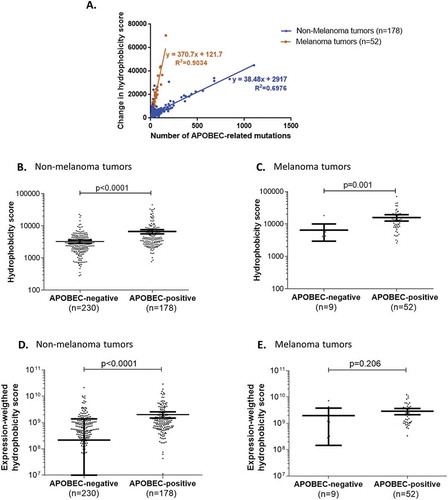
Figure 3. Response and progression-free survival comparison between patients treated with checkpoint blockade presenting differential APOBEC-related mutagenesis phenotypes.
An estimate of the APOBEC-related mutagenesis was obtained for each patient using the AMSE tool. Patients were classified in low APOBEC-related mutagenesis phenotype for scores ≤ 0.727 and in high APOBEC-related mutagenesis phenotype for scores > 0.727. Panels A: Pie-charts of response in patients presenting a low versus high APOBEC-related mutagenesis score. Panel B: Kaplan-Meier curve for progression-free survival of patients with APOBEC-related mutagenesis score low versus high.Abbreviations: CI = confidence interval; HR = hazard ratio; OR = odds ratio.
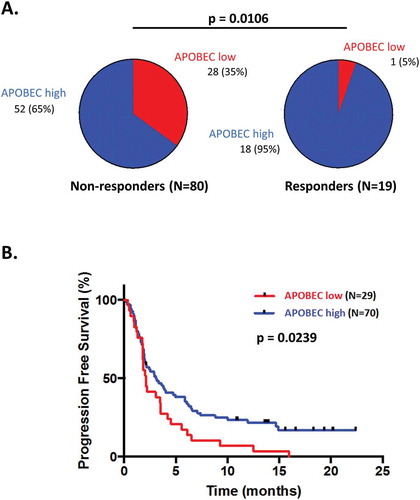
Table 3. Factors affecting the outcome of patients treated with immunotherapy agents.