Figures & data
Figure 1. Changes in PD-1 receptor and ligand expression following stimulation. Flow cytometry analysis of (a) PD-1 (CD279) expression on 1) IL-2, 2) Zol and 3) Zol+ IL-2 stimulated PBMC compared to unstimulated PBMC and gated on γδ T-cells or αβ T-cells. (b) PD-L1 (CD274) expression on 1) IL-2, 2) Zol and 3) Zol+ IL-2 stimulated PBMC compared to unstimulated PBMC and gated on γδ T-cells. Data of 5 independent experiments are presented as mean of the Δ-MFI [(MFI(PD-1/-L1) minus MFI(isotype)] ± SEM (upper row) or as fraction of PD-1/-L1 positive cells (lower row) in the respective subset, * = P < .05 compared to unstimulated control.
![Figure 1. Changes in PD-1 receptor and ligand expression following stimulation. Flow cytometry analysis of (a) PD-1 (CD279) expression on 1) IL-2, 2) Zol and 3) Zol+ IL-2 stimulated PBMC compared to unstimulated PBMC and gated on γδ T-cells or αβ T-cells. (b) PD-L1 (CD274) expression on 1) IL-2, 2) Zol and 3) Zol+ IL-2 stimulated PBMC compared to unstimulated PBMC and gated on γδ T-cells. Data of 5 independent experiments are presented as mean of the Δ-MFI [(MFI(PD-1/-L1) minus MFI(isotype)] ± SEM (upper row) or as fraction of PD-1/-L1 positive cells (lower row) in the respective subset, * = P < .05 compared to unstimulated control.](/cms/asset/8f7652b3-4ddf-4166-ab9a-fe9d5655e724/koni_a_1550618_f0001_b.gif)
Figure 2. Proliferation of immune cells. Cell concentrations of different immune cell subpopulations (γδ T-cells, αβ T-cells and NK-cells) were determined by flow cytometry analysis. The four graphs depict different types of stimulation and compare additional stimulation without isotype control antibody and Pembrolizumab (both at 10 µg/ml) each on d2 and d7. All data are presented as mean + SEM of 4 independent experiments.
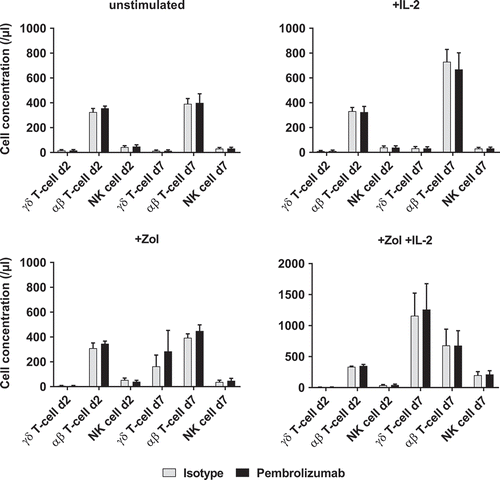
Figure 3. Expression of activation markers. Flow cytometry analysis of activation markers CD69 and HLA-DR on 1) unstimulated, 2) + IL-2, 3) + Zol and 4) + Zol + IL-2 stimulated PBMC with Isotype antibody or Pembrolizumab gated on γδ T-cells. All data are presented as mean + SEM of 4 independent experiments.
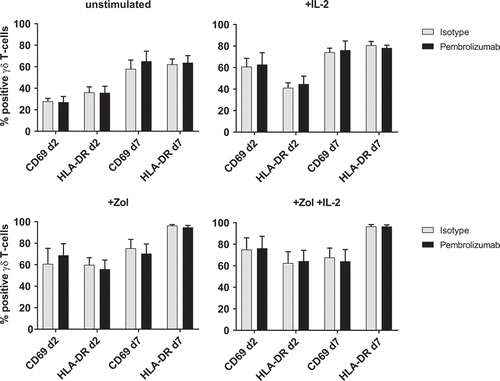
Figure 4. IFN-γ production of γδ T-cells in response to stimulation of PBMC. Normalized cyIFN-γ production of γδ T-cells from flow cytometry analysis of (a) unstimulated and (b) Zol stimulated PBMC after 48h with either isotype control antibody or Pembrolizumab (both 1 µg/ml). For the purpose of normalization, each MFI of the cytoplasmic interferon-γ (IFN-γ) measurement following Zol stimulation was related to the MFI of cyIFN-γ measurement following Zol + IL-2 stimulation obtained from the same donor in the same experiment: 100% cyIFN-γ production: MFI(X)/MFI(control) *100. All data are presented as mean ± SEM of 5 independent experiments. * = P < .05.
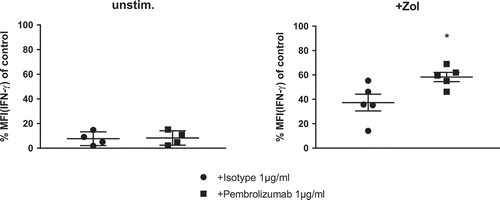
Figure 5. IFN-γ production and degranulation of γδ T-cells in response to leukemia cell lines. Flow cytometry analysis of cytoplasmic interferon-γ (IFN-γ) production and expression of degranulation marker CD107a by γδ T-cells. (a) Comparing co-culture of unstimulated PBMC with different leukemia cell lines (KG-1, THP-1, K562 and HL60) that were either previously kept unstimulated (unstim.) or sensitized with 10 µM Zol (+ Zol) for 48h. (b) Normalized cyIFN-γ production and expression of CD107a following co-culture of unstimulated PBMC with either unstimulated or + Zol treated leukemia cell lines (KG-1, THP-1, K562 and HL60) and treatment with either isotype antibody or Pembrolizumab (both at 10 µg/ml). All used leukemia cell lines were irradiated with 14gy directly before initiation of co-culture to prevent excessive growth and depletion of medium. For the purpose of normalization, each MFI of the cyIFN-γ or CD107a measurements following co-culture with unstimulated and + Zol cell lines with either isotype antibody or Pembrolizumab is related to the MFI of cyIFN-γ or CD107a measurement following co-culture with identically stimulated cell lines without antibody (= control) that were obtained from the same donor in the same experiment. All data are presented as mean + SEM of 3 independent experiments. * = P < .05 comparing (a) response to co-culture with unstimulated and + Zol sensitized leukemia cell lines, (b) Pembrolizumab and isotype antibody treatment.
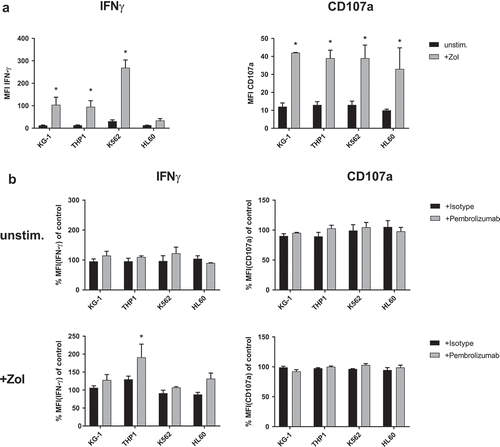
Figure 6. IFN-γ production and degranulation of γδ T-cells in response to primary leukemia cells. Flow cytometry analysis of cytoplasmic interferon-γ (IFN-γ) production and expression of degranulation marker CD107a by γδ T-cells. (a) Comparing co-culture of unstimulated PBMC with primary AML leukemia cells that were either kept unstimulated (unstim.) or sensitized with 10 µM Zol (+ Zol) for 48h. (b) Normalized cyIFN-γ production and expression of CD107a following co-culture with either unstimulated or Zol treated primary AML cells and treatment with either isotype antibody or Pembrolizumab (both at 10 µg/ml). For the purpose of normalization, each MFI of the cyIFN-γ or CD107a measurements following co-culture with unstimulated and + Zol primary AML with either isotype antibody or Pembrolizumab is related to the MFI of cyIFN-γ or CD107a measurement following co-culture with identically stimulated primary AML without antibody (= control) that were obtained from the same donor in the same experiment. (c) Ratio of PD-1 positive γδ T-cells of all PBMC comparing different types of co-culture. (d) Comparing PD-1 positive and negative γδ T-cells production of cyIFN-γ and expression of CD107a following co-incubation with Zol sensitized primary AML. All data are presented as mean + SEM of 4–6 independent experiments and primary AMLs. * = P < .05 comparing (a) response to co-culture with unstimulated and Zol sensitized primary AML, or (b) Pembrolizumab and isotype antibody treatment, (c) co-incubation with either non sensitized or + Zol sensitized primary AML and (d) PD-1(+) and PD-1(-) cells.
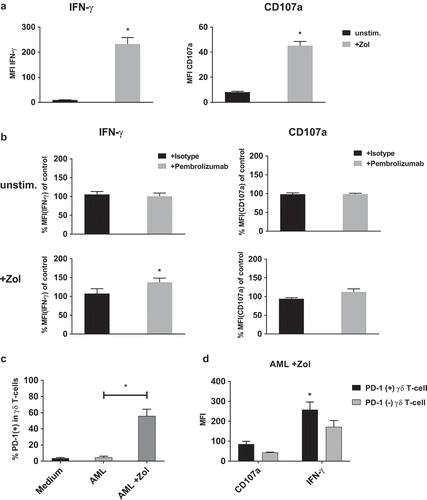
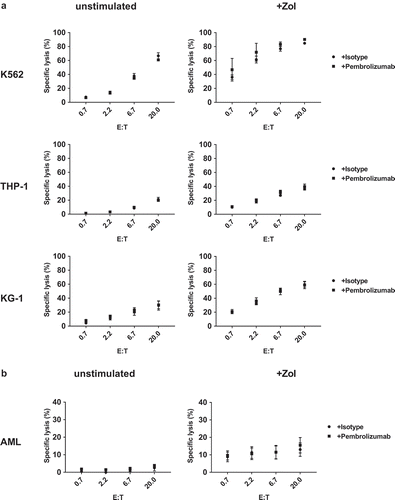
Figure 7. Cellular cytotoxicity against primary AML and leukemia cell lines. Target cells (a) leukemia cell lines (K563, THP-1 and KG-1) and (b) primary AML blasts were incubated in triplicates with stimulated PBMC containing > 80% γδ T-cells in different effector to target ratios (E:T). Target cell specific lysis was measured using a flow cytometry-based cellular cytotoxicity assay based on target cell labeling with PKH stain and nucleic acid-specific To-Pro-3 iodide stain. Specific cytotoxicity was calculated as: (TO-PRO-3(+) target cell co-incubated with effector cells minus TO-PRO-3(+) target cell without effector cells)/(100 minus TO-PRO-3(+) target cells without effector cells). All data are presented as mean ± SEM of 4–7 independent experiments.
