Figures & data
Figure 1. TCRVγ9Vδ2 T cells in FL lymph node biopsies. (a) Representative dot plots of γδ T cells (TCRVγ9+/CD3+), B cells (CD19+/CD3−), and TCRVγ9+/CD16+ cells. (b) Quantification of total B, γδ T, NK (CD3−CD56+) cells, CD4+ and CD8+ lymphocytes from healthy tonsils (black circle, n = 10) and FL lymph nodes (red circle, n = 10). (c) Sample enrichment scores (SES) of different cells subtypes in 198 FL patients and correlation of “γδ T-cell” SES with expression levels of the TRGV9 and TRGV5 genes, and the cytolytic index. (d) Representative section from FL lymph node showing TCR gamma chain staining (red arrow) (bar = 100µm); original magnification x100; zoom insert: original magnification x400).
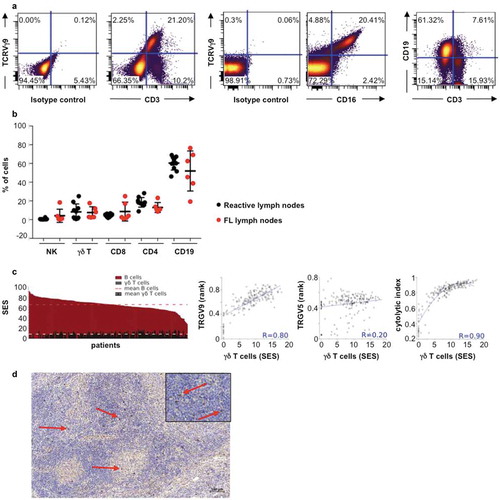
Figure 2. Expression of PD-1 on FL-infiltrating TCRVγ9Vδ2 T cells. (a) Mean of fluorescence intensity (mfi) of PD-1 in each different CD3, CD8, CD4, γδ T and CD19 cells in FL biopsies (n = 3 ± SD). (b) Percent of PD-1+ cells relative to the number of CD3+ cells for each lymphocyte subtype. Black bars represent the total percent of CD3+ cells, and bars with dots represent the percent of PD1+ cells in three independent FL samples (±SD). (c) Percent of CD16+, PD-1+, and CD16+/PD-1+ cells in the γδ T cells fraction in three independent FL samples (±SD). (d) Correlation between SES for a ‘PD-1 axis’ gene set and that of a ‘γδ T-cell’ (black) or ‘B cell’ (red) geneset. Regression lines are shown for 198 FL transcriptomes. (e) Left: SES dot plots for IEGS33 versus cytolytic index for the 198 FL samples. Right: SES γδ T cells mean ± sd in the 4 groups: group I (IEGS33−/cytolytic index−), group II (IEGS33−/cytolytic index+), group III (IEGS33+/cytolytic index+), group IV (IEGS33+/cytolytic index−).
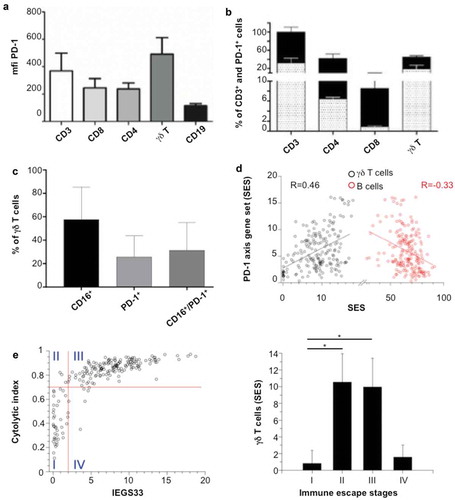
Figure 3. TCRVγ9Vδ2 T cell- MALC co-culture model. (a) Representative dot plot of CD69 and PD-1 expression in normal γδ T lymphocytes stimulated by BrHPP/IL2. (b) CD69 and PD-1 expression in activated normal γδ T lymphocytes (n = 8–10) at different times of culture. * p < 0.05. (c) Left: representative dot plots of CD16 and PD-1 expression in two γδ T lymphocytes long-term culture obtained from healthy donors. Right: composite result showing CD16 and PD-1 expression in γδ T long-term cell culture (n = 11). (d) mfi of PD-L1 and PD-L2 in RL cells cultured in 2D or in MALC (upper panel at day 10, lower panel at different time points) evaluated by flow cytometry. *: p < 0.05, **: p < 0.01, ***: p < 0.001. (e) Visualization of PD-L1 and PD-L2 by confocal microscopy in MALC realized with RL-GFP at days 5 and 10 of culture.
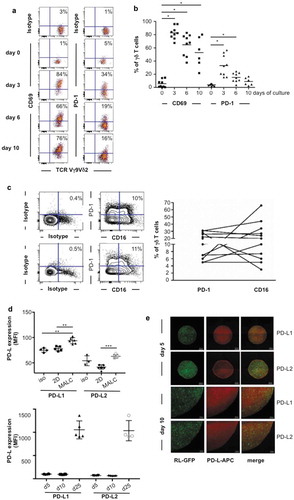
Figure 4. Visualization of γδ T cells and mAbs penetration within the MALC. (a,c,e,g) Temporal evolution of relative area of mAbs (A, E) and γδ T cells (C, G) with respect to the MALC total area (0 = no penetration, 1 = full penetration) (A, C, n = 3; E, G n = 4). (b,d,f,h) Dynamics and spatial distribution pattern of penetration of mAbs (B, F) and γδ Tcells (D, H) (blue = low intensity signal, yellow = high intensity signal) within the MALC for one experiment. (i) Visualization of MALC-GFP (green), GA101 (purple) and γδ T cells (red) at multiple time points. All the images were taken from the same z-plane inside the MALC.
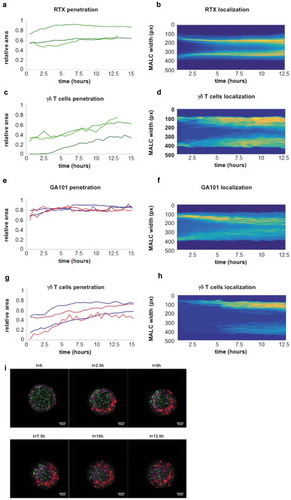
Figure 5. In vitro ADCC in TCRVγ9Vδ2 T cell- MALC co-culture model. RL cells in suspension (2D) or MALC at day 10 of culture were incubated or not with γδ T cells at the indicated ratios (effector (γδ T cells):target (RL cells); E:T) in presence or not (UT) of RTX or GA101 at 10 µg/ml. (a,b) ADCC was measured after 4 hrs by cytolytic activity of γδ T cell effectors (% of CD107a+ γδ T cells- A) and by FL target cell death (% of DAPI+ CD19+ cells- B). (c) MALC volume was visualized and measured after 24 hrs. (d, e) γδ T cells were preincubated 20 min with 5 µg/ml of Fc blocker and then co-cultured with MALC (day 10) at E:T 0.5:1 in presence of not (UT) of mAbs at 10 µg/ml. Percent of CD107+ γδ T cells and DAPI+CD19+ were measured after 4 hrs. Each point represents an independent sample and red lines represent the median for each condition. *: p < 0.05, **: p < 0.01, ***: p < 0.001.
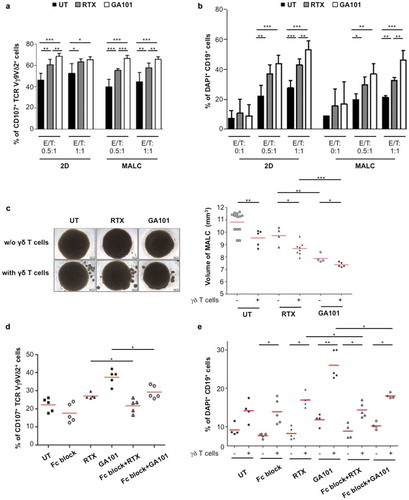
Figure 6. Effect of anti-PD-1 mAbs on ADCC induced by anti-CD20. γδ T cells were pretreated or not for 12 hrs with anti-PD-1 mAb at 10 µg/mL and added to MALC at day 10 of culture at an E/T ratio of 0.5:1. (a,b) ADCC was measured after 4 hrs by cytolytic activity of γδ T cell effectors (% of CD107a+ on γδ T cells- A) and by FL target cell death (% of DAPI+ CD19+ cells- B). (c) MALC volume was visualized and measured after 24 hrs. Each point represents an independent sample and red lines represent the median for each condition. *: p < 0.05, **: p < 0.01, ***: p < 0.001.
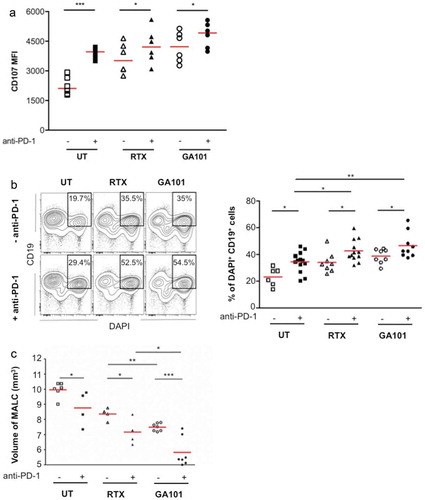
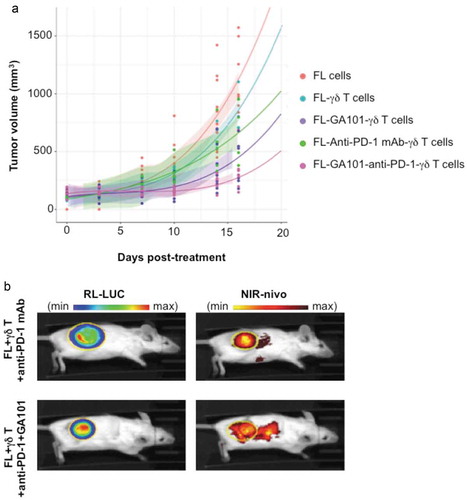
Figure 7. In vivo effect and localization of anti-PD-1 mAb. (a) SCID-Beige mice were engrafted with RL cells. 5 cohorts of 6 animals were treated or not with anti-PD-1 (10 mg/kg), GA101 (30 mg/kg) or both in the presence (FL + γδ T) or absence (FL cells) of γδT cells. Tumor volume (TV) was measured with a caliper and results represent the mean of TV in mm3 for 6 independent mice in each condition. (b) Tumor and anti-PD-1 mAb visualization at day 29 post-engraftment by IVIS Spectrum on representative mice injected with γδ T cells and treated with NIR-labeled anti-PD-1 (25 µg) alone or in combination with GA101 (30 mg/kg). Left panel, FL tumor (RL-LUC) visualized by bioluminescence imaging. Right panel, NIR-labeled anti-PD-1 visualized by fluorescence imaging. Yellow circle: region of interest (ROI).