Figures & data
Figure 1. Microarray analysis of monocyte-derived DCs activated with LPS in the presence or in the absence of 22R-Hydroxycholesterol. (a-b) Pairwise comparison between datasets from untreated and 22R-HC-treated samples revealing a differential modulation of 1517 unique genes (in supplementary Table 1). (a) 786 genes resulted to be upregulated, and (b) 731 downregulated, considering an absolute fold change of 1.5 and FDR H&B < 0.05 (c-d) Gene Ontology Biological Process (BP) enrichment analysis showing up-regulated (c) and down-modulated (d) pathways.
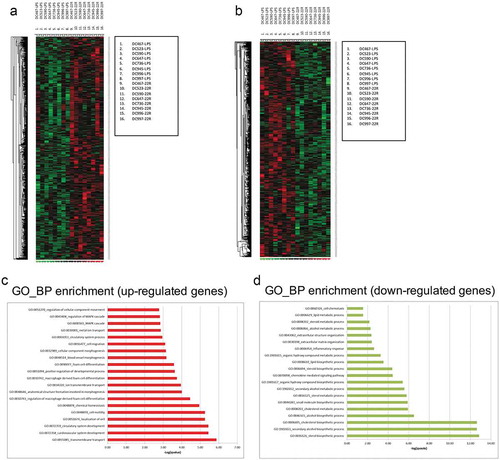
Figure 2. Kinetics of TREM-1 expression by DCs treated with LXR ligands. (a-c) Analysis of TREM-1 mRNA expression by immature and mature monocyte-derived DCs treated with 22R-HC for 6 (a), 16 (b) and 24 (c) hours. Results are representative of three experiments. *, P < 0.05; **, P < 0.01; ***, P < 0.001; ****, P < 0.0001; ns, not significant (Student’s t test). (d) A representative FACS analysis of TREM-1 expression by untreated, LPS-treated and LPS plus 22R-HC-treated DCs is shown. (e) Quantification of the flow cytometry analysis as in (d). Each symbol corresponds to one DC donor tested, and the line represents the mean value. ***, P < 0.001; ****, P < 0.0001 (analysis of variance ANOVA). (f) Quantification of FACS analysis of DCs treated for 24 hours with LPS and the synthetic LXR agonist T0901317 (T1317). Each symbol corresponds to one DC donor tested, and the line represents the mean value. ***, P < 0.001; ****, P < 0.0001 (analysis of variance ANOVA). In figures D and E, DCs were treated with LPS and LPS plus 22R-HC for 24 hours.
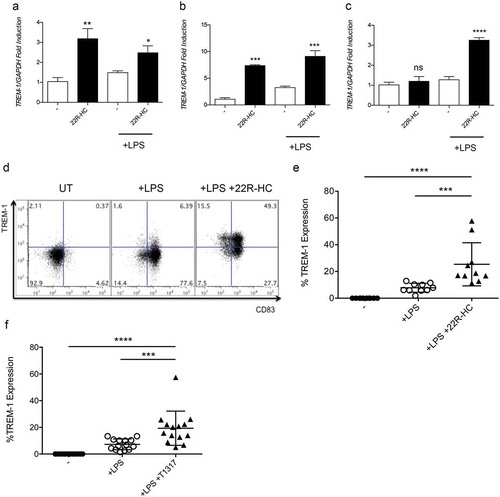
Figure 3. Expression of TREM-1 by DCs treated with RXR, RAR or VDR ligands. (a) Analysis of TREM-1 mRNA expression by monocyte-derived DCs treated with LPS plus 22R-HC, or AtRA, or 9-cis RA or 1α,25dihydroxyvitamin D3 for 24 hours. (b) A representative FACS analysis showing TREM-1 expression by DCs treated with LPS, LPS plus 9-cis RA, or AtRA or 1α,25dihydroxyvitamin D3. (c) Quantification of FACS analysis as in (b). (d) Quantification of FACS analysis as in (b). (e) Quantification of FACS analysis as in (b). Each symbol corresponds to one DC donor tested, and the line represents the mean value. ****, P < 0.0001 (analysis of variance ANOVA). (f) Quantification of FACS analysis of DCs treated with LPS, LPS plus 9-cis RA (100 nM), and LPS plus 9-cis RA (100 nM) and 22R-HC (5 μM). Each symbol corresponds to one DC donor tested, and the line represents the mean value. ***, P < 0.001; ****, P < 0.0001 (analysis of variance ANOVA).
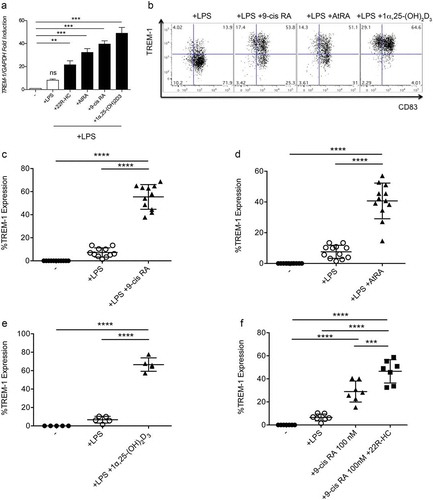
Figure 4. Chromatin Immunoprecipation assays. (a) In silico analysis of the TREM-1 promoter showing different putative LXRE and RARE responsive elements in the untranslated region between −345 and +1 bp. (b) qPCR experiments showing TREM-1 mRNA expression by U937 differentiated with PMA for 72h and then treated with T1317 or AtRA. Results are representative of three experiments. *, P = 0.021; ***, P < 0.001 (analysis of variance ANOVA). (c-d) The selective fold enrichments of the LXRE responsive elements in the SREBP-1c promoter used as control (c) and in the putative TREM-1 promoter site (d), are shown. U937 cells were treated as described in (b). UT: Untreated. Results are representative of two experiments. *, P = 0.012; **, P = 0.0074 (Student’s t test).
Figure 5. Expression and function of TREM-on myeloid DCs isolated from the blood of donors. (a) Quantification by FACS of TREM-1 expression by myeloid DCs treated with LPS, LPS plus 22R-HC, LPS plus AtRA, LPS plus 9-cis RA, and LPS plus 1α,25dihydroxyvitamin D3. Results are representative of three experiments. *, P < 0.05; **, P < 0.01; ns, not significant (analysis of variance ANOVA). (b-c) TNFα (b) and IL-1β (c) release by myeloid DCs treated with LPS plus nuclear receptor ligands as described in (a) and triggered for 24h by anti-TREM-1 mAb or IgG ctrl. Results are representative of 3–4 experiments. *, P < 0.05; **, P < 0.01; ***, P < 0.001 (analysis of variance ANOVA). (d) IL-23 release by myeloid DCs treated with LPS plus nuclear receptor ligands as described in (a) and triggered for 24h by anti-TREM-1 mAb or IgG ctrl. Results are representative of 2 experiments. *, P < 0.05 (analysis of variance ANOVA). (e) FACS analysis showing TNFα+ and IFNγ+ cytokine staining of allogeneic naïve CD4+ T cells stimulated for 6 days with DCs treated with 9-cis RA and triggered by anti-TREM-1 mAb or IgG ctrl. (f) Fold change of TNFα+/IFNγ+ CD4+ T cells co-cultured with DCs stimulated with LPS plus 9-cis RA over TNFα+/IFNγ+ CD4+ T cells co-cultured with DCs stimulated with LPS alone. Results are representative of 2 experiments. *, P < 0.05; **, P < 0.01; ns, not significant (analysis of variance ANOVA).
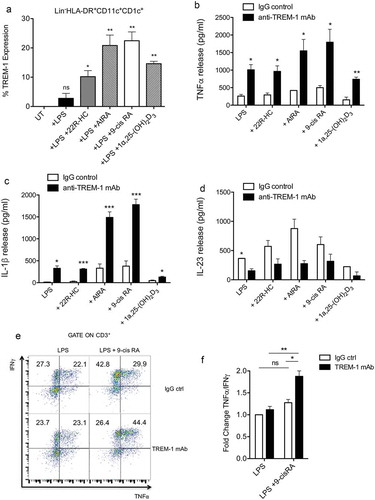
Table 1. Percentage of TREM-1+ DCs in fluids from cancer patients.
Table 2. Percentage of TREM-1+ DCs in the blood of healthy donors.
Figure 6. Expression of TREM-1 by DCs isolated from neoplastic fluids of advanced cancer patients. (a-b) Analysis of TREM-1 expression by CD11b+ cells purified from neoplastic fluids (a, pleural effusion; b, ascites) and further analyzed by FACS for HLA-DR, CD11c, CD1c, CD16 and TREM-1. TREM-1 was expressed by a subset of CD1c+CD16+ cells present in neoplastic fluids and blood of healthy donors (a, upper panel), and by HLA-DR+CD11c+CD1c+CD16− DCs, which were almost exclusively present in neoplastic fluids. (c) Whisker plot analysis showing the percentage of HLA-DR+CD11c+CD1c+CD16− DCs expressing TREM-1 in the fluids of 9 advanced cancer patients and in the blood of 9 healthy donors. *, P = 0.013 (Wilcoxon matched-pairs signed rank test). (d-e) Linear regression analyses between TREM-1 expression and ABCA1 (d) or TGM-2 expression (e).
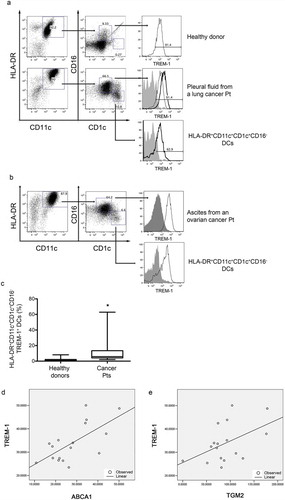
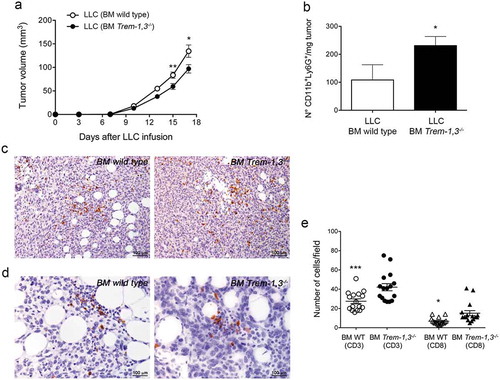
Figure 7. LLC tumor growth in wild type (WT) and Trem-1,3−/- bone marrow chimera mice. (a) Growth of LLC in WT and Trem-1,3−/- chimera mice (n = 12–14 mice per group; mean ± SEM). **, P = 0.0073; *, P = 0.022 (Student’s t test). (b) Number of CD11b+Ly6G+ neutrophils infiltrating LLC injected in WT or in Trem-1,3−/- chimera mice (n = 5 mice per group; mean ± SEM). *, P = 0.04 (Student’s t test). (c) Immunohistochemistry for CD3+ cells infiltrating LLC tumors grown in WT (left) and Trem-1,3−/- (right) chimera mice. Original magnification 200x; bar, 100 μm. (d) Immunohistochemistry for CD8+ cells infiltrating LLC tumors grown in WT (left) and Trem-1,3−/- (right) chimera mice. Original magnification 400x; bar, 100 μm. (e) Quantification of the results shown in C and D. The amount of immunoreactive CD3+ and CD8+ cells was calculated as the number of positive cells in tumor areas at 400x magnification in 16 high-power fields enriched of T lymphocytes. *, P < 0.05; ***, P < 0.001 (analysis of variance ANOVA).