1,076
Views
4
CrossRef citations to date
0
Altmetric
Original Research

The regulatory capacity of B cells directs the aggressiveness of CLL

, , , , , ORCID Icon, , , , , , & ORCID Icon show all
Article: 1554968 | Received 24 Jul 2018, Accepted 27 Nov 2018, Published online: 12 Dec 2018

Figures & data

Figure 1. The regulatory activity of TLR9-stimulated CLL B cells is impaired. Purified peripheral blood T cells from CLL patients were labeled with cell trace violet (CTV), stimulated with anti-CD3 and anti-CD28 mAbs, and their proliferative response evaluated by the decreased CTV fluorescence intensity after four days of cultures with or without purified autologous CpG-stimulated B cells added at a 1:1 ratio. (a) Representative examples of T cell proliferation (left) and determination (right) of Reg POS CLL (n = 30) and Reg NEG CLL (n = 26) B cell regulatory activities evaluated as the B cell-induced inhibition of T cell proliferation. (b) Correlations between the B cell-induced inhibition of the T cell proliferation and the concentrations of IL-10 and TGF-β in the supernatants determined by ELISA. Regression lines are shown. (c) Frequencies of CD19+ DRAQ7+ died B cells after 4 days of co-cultures evaluated by flow cytometry. (d) Regulatory activities of Reg POS CLL (n = 3) and Reg NEG CLL (n = 6) B cells evaluated in co-cultures with T cells at various T cell:B cell ratio. Results are expressed as Mean ± SEM. *p < 0.05; **p < 0.01; ***p < 0.001; ns, not significant.

Figure 1. The regulatory activity of TLR9-stimulated CLL B cells is impaired. Purified peripheral blood T cells from CLL patients were labeled with cell trace violet (CTV), stimulated with anti-CD3 and anti-CD28 mAbs, and their proliferative response evaluated by the decreased CTV fluorescence intensity after four days of cultures with or without purified autologous CpG-stimulated B cells added at a 1:1 ratio. (a) Representative examples of T cell proliferation (left) and determination (right) of Reg POS CLL (n = 30) and Reg NEG CLL (n = 26) B cell regulatory activities evaluated as the B cell-induced inhibition of T cell proliferation. (b) Correlations between the B cell-induced inhibition of the T cell proliferation and the concentrations of IL-10 and TGF-β in the supernatants determined by ELISA. Regression lines are shown. (c) Frequencies of CD19+ DRAQ7+ died B cells after 4 days of co-cultures evaluated by flow cytometry. (d) Regulatory activities of Reg POS CLL (n = 3) and Reg NEG CLL (n = 6) B cells evaluated in co-cultures with T cells at various T cell:B cell ratio. Results are expressed as Mean ± SEM. *p < 0.05; **p < 0.01; ***p < 0.001; ns, not significant.

Figure 2. CLL T cell proliferative response is effective. T and B cells were purified from the peripheral blood of CLL patients and healthy controls (HC). T cells were labeled with cell trace violet (CTV), stimulated with anti-CD3 and anti-CD28 mAbs, and their proliferative response evaluated by the decreased CTV fluorescence intensity after four days of cultures with or without CpG-stimulated B cells. (a) Frequencies of CD19-DRAQ7+ died T cells after 4 days of co-culture evaluated by flow cytometry and CD4:CD8 T cells ratio in peripheral blood before co-culture. (b) Proliferation capacity of Reg POS CLL (n = 6) and Reg NEG CLL (n = 6) CD4+ T cells and CD8+ T cells stimulated without B cells. (c) Determination of the CLL B cell-induced inhibition of autologous CD4+ T cell and CD8+ T cell proliferation. (d) Regulatory activities of Reg POS CLL (n = 8) and Reg NEG CLL (n = 16) B cells evaluated in heterologous co-cultures with HC cells. Mean ± SEM. *p < 0.05; **p < 0.01, ***p < 0.001; ns, not significant.

Figure 2. CLL T cell proliferative response is effective. T and B cells were purified from the peripheral blood of CLL patients and healthy controls (HC). T cells were labeled with cell trace violet (CTV), stimulated with anti-CD3 and anti-CD28 mAbs, and their proliferative response evaluated by the decreased CTV fluorescence intensity after four days of cultures with or without CpG-stimulated B cells. (a) Frequencies of CD19-DRAQ7+ died T cells after 4 days of co-culture evaluated by flow cytometry and CD4:CD8 T cells ratio in peripheral blood before co-culture. (b) Proliferation capacity of Reg POS CLL (n = 6) and Reg NEG CLL (n = 6) CD4+ T cells and CD8+ T cells stimulated without B cells. (c) Determination of the CLL B cell-induced inhibition of autologous CD4+ T cell and CD8+ T cell proliferation. (d) Regulatory activities of Reg POS CLL (n = 8) and Reg NEG CLL (n = 16) B cells evaluated in heterologous co-cultures with HC cells. Mean ± SEM. *p < 0.05; **p < 0.01, ***p < 0.001; ns, not significant.

Figure 3. Phenotypic characteristics of CLL B cells. (a) Representative examples of peripheral B cell flow cytometry analysis from healthy controls (HC), Reg POS CLL and Reg NEG CLL patients. (b) Mean fluorescence intensity (MFI) of all markers analyzed on HC (n = 29), Reg POS CLL (n = 21) and Reg NEG CLL (n = 20) B cells. Representative examples of CD40 expression on HC (n = 5), Reg low CLL (n = 5) and Reg NEG CLL (n = 5) B cells. (c) Determination of HC, Reg POS CLL and Reg NEG CLL B cell regulatory activities evaluated as the CpG-activated B cell-induced inhibition of T cell proliferation in a 4-day autologous co-culture with or without anti-CD40L blocking mAb. Results are expressed as Mean ± SEM. *p < 0.05; **p < 0.01, ***p < 0.001; ns, not significant.

Figure 3. Phenotypic characteristics of CLL B cells. (a) Representative examples of peripheral B cell flow cytometry analysis from healthy controls (HC), Reg POS CLL and Reg NEG CLL patients. (b) Mean fluorescence intensity (MFI) of all markers analyzed on HC (n = 29), Reg POS CLL (n = 21) and Reg NEG CLL (n = 20) B cells. Representative examples of CD40 expression on HC (n = 5), Reg low CLL (n = 5) and Reg NEG CLL (n = 5) B cells. (c) Determination of HC, Reg POS CLL and Reg NEG CLL B cell regulatory activities evaluated as the CpG-activated B cell-induced inhibition of T cell proliferation in a 4-day autologous co-culture with or without anti-CD40L blocking mAb. Results are expressed as Mean ± SEM. *p < 0.05; **p < 0.01, ***p < 0.001; ns, not significant.

Figure 4. Specific TLR9 pathway functionalities in CLL B cells. (a) Peripheral B cells from Reg POS CLL and Reg NEG CLL patients were stimulated for 2 days with or without CpG-ODN. Representative examples of CD86, CD25, CD69 and CD40 expression analyzed by flow cytometry (upper) and index of induction (lower) on Reg POS CLL (n = 5) and Reg NEG CLL (n = 5) B cells. Results are expressed as Mean±SEM.***p < 0.001. (b-c) After 3 days of co-cultures with autologous activated T cells, CpG-stimulated HC, Reg POS CLL and Reg NEG CLL B cells were sorted. TLR-associated gene expressions were assessed using TaqMan array qRT-PCR and protein expressions assessed by Western Blot. (b) Heat maps of differential expression profiles (Ct values) between Reg POS CLL and Reg NEG CLL B cells are shown. (c) Fold change expression of mRNA and proteins in Reg POS and Reg NEG CLL B cells compared to HC B cells.

Figure 4. Specific TLR9 pathway functionalities in CLL B cells. (a) Peripheral B cells from Reg POS CLL and Reg NEG CLL patients were stimulated for 2 days with or without CpG-ODN. Representative examples of CD86, CD25, CD69 and CD40 expression analyzed by flow cytometry (upper) and index of induction (lower) on Reg POS CLL (n = 5) and Reg NEG CLL (n = 5) B cells. Results are expressed as Mean±SEM.***p < 0.001. (b-c) After 3 days of co-cultures with autologous activated T cells, CpG-stimulated HC, Reg POS CLL and Reg NEG CLL B cells were sorted. TLR-associated gene expressions were assessed using TaqMan array qRT-PCR and protein expressions assessed by Western Blot. (b) Heat maps of differential expression profiles (Ct values) between Reg POS CLL and Reg NEG CLL B cells are shown. (c) Fold change expression of mRNA and proteins in Reg POS and Reg NEG CLL B cells compared to HC B cells.

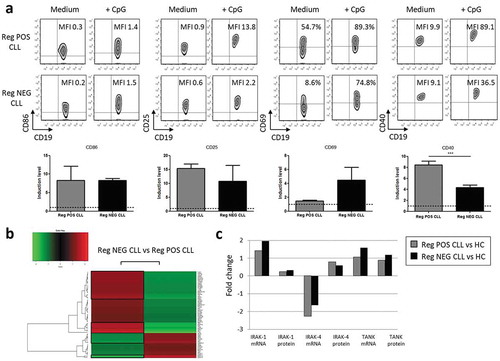
Table 1. Differential expression of the TLR9 pathway-associated genes in Reg NEG CLL B cells compared to Reg POS CLL B cells.

Table 2. Clinical characteristics of the CLL patients.

Figure 5. Patients with regulatory B cell activity present a more aggressive form of CLL. Comparisons of chromosomal abnormalities (a) and IGVH mutational status (b) between Reg POS CLL and Reg NEG CLL patients. (c-d) Kaplan-Meier graphs for the comparisons between Reg POS CLL and Reg NEG CLL patients according to their IGVH mutational status. (c) Comparisons of the doubling time of lymphocytosis. (d) Comparisons of the time to first treatment. ns, not significant.

Figure 5. Patients with regulatory B cell activity present a more aggressive form of CLL. Comparisons of chromosomal abnormalities (a) and IGVH mutational status (b) between Reg POS CLL and Reg NEG CLL patients. (c-d) Kaplan-Meier graphs for the comparisons between Reg POS CLL and Reg NEG CLL patients according to their IGVH mutational status. (c) Comparisons of the doubling time of lymphocytosis. (d) Comparisons of the time to first treatment. ns, not significant.

Reprints and Corporate Permissions

Please note: Selecting permissions does not provide access to the full text of the article, please see our help page How do I view content?

To request a reprint or corporate permissions for this article, please click on the relevant link below:

Academic Permissions

Please note: Selecting permissions does not provide access to the full text of the article, please see our help page How do I view content?

Obtain permissions instantly via Rightslink by clicking on the button below:

If you are unable to obtain permissions via Rightslink, please complete and submit this Permissions form. For more information, please visit our Permissions help page.