Figures & data
Figure 1. Antigen loading by CLIP-replaced invariant chain results in efficient activation of both CD4+ and CD8+ T cells. (a) representation of the TGFbRII protein and the specific domains (Wild-type, WT, upper panel and frameshift mutant lower panel). The red arrowhead points at the frameshift site and the amino acid sequence is depicted. In blue the WT sequence and in red the mutant sequence resulting from the frameshift mutation. The invariant chain constructs are compared to the WT and the position of the epitope replacements are indicated. (b) Activation of CD8+ T cells was monitored by CD107a surface expression. In vitro expanded T cells were electroporated with Radium-1 TCR mRNA and co-incubated for 5 h with autologous EBV-LCL (APC) previously electroporated with the indicated construct (SCT = single chain trimer; frameshift mutant = full-length frameshift mutant construct; Ii wild-type (p35 isoform); IiTGF19AA; IiTGF9AA), loaded with the 19AA peptide or untreated. Graphs are representative of two independent experiments. (c) Same experiment as in (b) where the T cells were electroporated with Radium-6 TCR and TNF-α accumulation was detected after O/N incubation. Data are shown as mean ± S.D. (n = 4), ****P < 0.0001, *** P < 0.001 by ANOVA and Dunnett’s multiple comparison test, N = 2, except for SCT where N = 1 and n = 2.
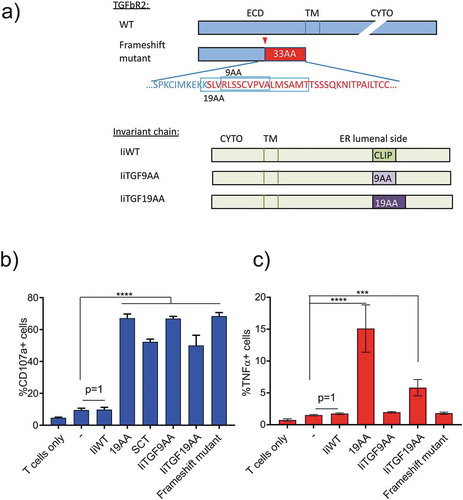
Figure 2. Loading of antigen by invariant chain is dependent on the length of antigenic insert. (a) Representation of the different Ii constructs used. (b) Functional assay of redirected T cells expressing Radium-1 TCR and incubated with APCs expressing the indicated constructs for 5 h. T cell activation was measured as percent of CD107a positive cells. APCs were autologous EBV-LCL (top) and T2 cell line (bottom) either electroporated with the indicated constructs or loaded with the 19AA peptide or untreated (-). Data are shown as mean ± S.D. (n = 2 for EBV-LCL and n = 4 for T2), *P < 0.05, **P < 0.01, ***P < 0.001 by ANOVA and Dunnett’s multiple comparison test, N = 2 for T2 and 1 for EBV-LCL. (c) Same experiment as in (b) where T cells were electroporated with Radium-6 TCR. T-cell activation was measured as the percent of TNF-α producing T cells. Normalized data where + peptide (19AA) was set at 100% are shown as mean ± S.D. (n = 4), *P < 0.05 and ****P < 0.0001 by ANOVA and Dunnett’s multiple comparison test, where N = 2–3 and n = 6–8.
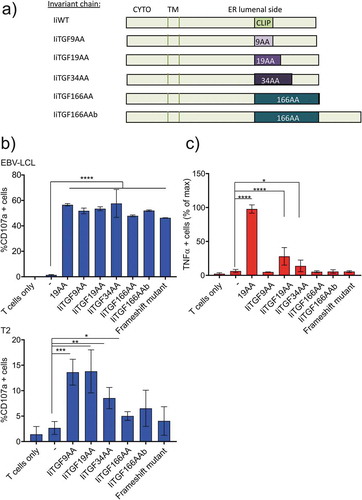
Figure 3. Intracellular trafficking of different CLIP-replaced constructs. a and b) Indicated Ii and dsRed-ER constructs were expressed in MDCK cells. 16–20 h later, cells were incubated in medium containing fluorochrome-labeled anti-Ii antibody (MB-741). The internalized antibodies were imaged in live cells, and the degree of co-localization between the early endosomal protein Rab5-RFP and the low pH marker lysotracker was quantified. After 1 h of incubation live cells were analyzed for colocalization between Ii and lysotracker in double positive lysosomes (a, arrows) Live cells were also analyzed for colocalization between Ii and Rab5 (red) positive endosomes (b, arrows). All co-localization values were obtained from independent experiments (N = 3) where at least 10 cells per experiment were analyzed (n > 10). Error bars are S.D. and significance was analyzed by Student’s t-test where ****P < 0.0001. (c) One representative example of sub-cellular localization of wild-type Ii (IiWT) and IiTGF166AA (upper and lower panel, respectively). These cells were fixed and permeabilized before staining with an anti-Ii antibody. (d) Quantification of the observed degree of co-localization in (c). The colocalization data were generated using ImageJ plugins. At least 10 cells were analyzed in five different optical regions (N = 3). Error bars are S.D and significance was analyzed by Student’s t-test where ****P < 0.0001. Bars 10 µm.
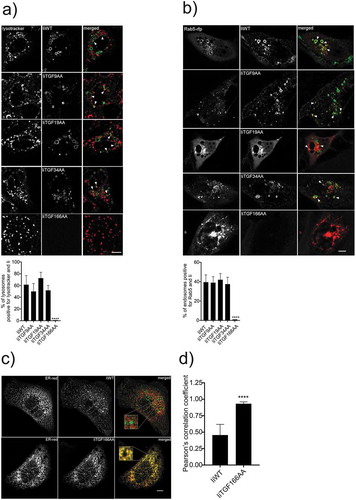
Figure 4. Comparison of minigene and Ii constructs stimulation. (a) Schematics showing the design of minigene and Ii constructs. (b) Functional assay of antigen loading efficiencies obtained when loading T2 cells with minigene. T2 cells were incubated with Radium-1 redirected T cells for 5 h prior to stimulation analysis. TNF-α+ cells were used as a readout for the frequency of stimulated T cells. Data are shown as mean ± S.D. (N = 2, n = 6), ****P < 0.0001, *** P < 0.001 by ANOVA and Dunnett’s multiple comparisons test. (c) Comparison of antigen loading between constructs shown in (a) in a functional assay. Post-transfection EBV LCL cells were incubated for increasing intervals of time, before aliquots were used to stimulate cognate T cells. Antigen loading was measured for both MHC-I and MHC-II using the same batch of EBV-LCL cells. Points show mean ± S.D. Multi-variated bi-directional Student t-test was used to compare invariant chain and minigene constructs for the two first time points (n = 3 for each condition).
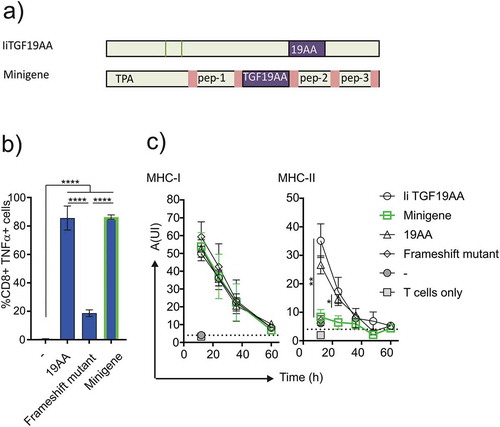
Figure 5. Antigen presentation by messengerRNA electroporated DCs. Monocyte-derived DCs isolated from healthy donors were differentiated and provided with antigen either at the mature or immature state. These DCs were either loaded with 19AA peptide (19AA) or electroporated with the indicated constructs (IiTGF19AA or the frameshift mutant construct). Control cells (-) were mock electroporated. In parallel, autologous T cells were electroporated with mRNA encoding the indicated TCR (Radium-1 or Radium-6). The electroporated cells (DCs and T cells) were finally co-incubated for 5 h and activation of T cells was monitored by TNF-α intracellular expression. Data are shown as mean ± S.D. of two separate experiments (N = 2, n = 3–5). Only significant variations are shown, **P < 0.01, ***P < 0.001, ****P < 0.0001 by ANOVA.
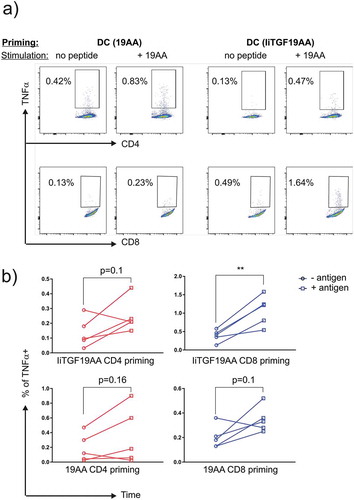
Figure 6. Priming of CD4+ and CD8 + T cells by DCs expressing IiTGF19AA. PBMC from a healthy donor were co-cultured with autologous DCs, either loaded with 19-mer TGF peptide (19AA) or expressing IiTGF19AA. On day 12, T-cell cultures were restimulated in the same conditions. On day 22, T cells were harvested and tested for the presence of peptide reactivity. This was done by performing a functional assay where TNF-α expression was detected by flow cytometry analysis. Here, autologous EBV-LCL were loaded or not with 19AA peptide and incubated for 12 h with the harvested T cell culture from the priming (Day 22). Cells were stained with anti-CD8, anti-CD4, and anti-TNF-α antibodies. The presence of TNFα producing T cells was monitored by flow cytometry. (a) Representative plot showing TNF-α signal in the indicated T-cell population (CD4 or CD8). In the top row, the priming method to obtain the T cell culture is depicted (peptide or Ii) and in the lower row the stimulation method for the detection of reactive T cells (EBV-LCL presenting cells loaded or not with peptide) is indicated. (b) Quantification of the experiment, as % of TNF-α observed in CD4 (red) and CD8 (blue) population. Signal from individual cultures was plotted (n = 5), significance was analyzed by Student’s t-test where **P < 0.01.