Figures & data
Figure 1. Murine embryonic stem cells expressing GM-CSF maintain their pluripotency.
(a) Schematic diagram of the plasmid with the EF1-α promoter driving GM-CSF expression. (b) Expression of GFP in GM-CSF-expressing ES-D3 cells and in empty vector control ES-D3 cells was evaluated by flow cytometry. (c) GM-CSF levels in transfected ES-D3 cells. ELISA measurements of GM-CSF concentrations in the medium of the indicated cells. The data are shown as mean ± standard deviations (mean ± SD) of three independements, **, p < 0.001; ANOVA with Tukey’s multiple comparison test, n.s = not significant. (d) Flow cytometry analysis of the expression of pluripotency and differentiation markers in parental, vector control and GM-CSF-expressing ES-D3 cells. The data shown are representative of three independent flow cytometry assays.
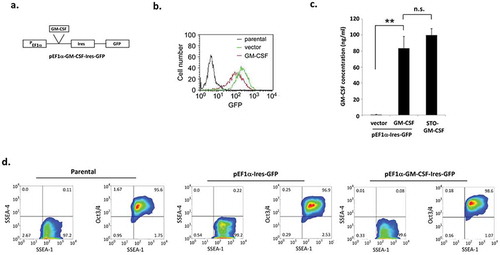
Figure 2. Characterization of exosomes isolated from ES-D3 cells.
(a) Exosomes were isolated from ES-D3 cells that were transfected with either the plasmid expressing GM-CSF or its empty vector. Transmission electron microscopy (TEM) imaging of the ES-D3-derived exosomes. Arrow heads indicate exosomes, Scale bar 100 nM. (b) Western blot analysis of the expression of the indicated exosomal markers, endoplasmic reticulum (ER) markers, mitochondrial markers, and cytosolic markers that are expressed either in the whole cell extracts (WCE) or in the exosomes. PDI, protein disulfide isomerase; cyto C, cytochrome C. Molecular weights markers (kD) are labeled on the left. (c) The amounts of GM-CSF in exosomes isolated from GM-CSF-expressing ES-D3 cells or from vector control ES-D3 cells were evaluated by ELISA. Exosomes pretreated with or without 0.05% Tween-20 were added to an ELISA plate. ELISA was carried out using washing buffer containing either PBS only or PBS + 0.05% Tween-20. The data are shown as mean ± SD of three independent ELISA experiments. ***, p < 0.0001; ANOVA with Tukey’s multiple comparison test.
Figure 3. ESC-derived exosome vaccination prevents the outgrowth of an implanted lung adenocarcinoma.
(a) Scheme of immunization. Male C57BL/6 mice were immunized twice (days 0 and 7) with vehicle only (HBSS control) or with exosomes isolated from the vector control ES-D3 cells (ES-exo) or with exosomes isolated from ES-D3 cells over-expressing GM-CSF (ES-exo/GM-CSF) in the right flank prior to s.c. challenge with LLC on day 14. (b) C57BL/6 mice (20 mice/group) were immunized twice (days 0 and 7) with HBSS (control) or ES-exo or ES-exo/GM-CSF in the right flank prior to s.c. challenge with LLC on day 14. Tumor growth was monitored daily in all animals until sacrifice due to tumors exceeding 5% of body weight. The ES-exo/GM-CSF-vaccinated tumor-free mice remained so for up to 4 months later with no overt signs of distress. Results are representative of three independent experiments. ***, p < 0.0001; relative to control group; log-rank test. (c) Tumor growth was measured with calipers every 2nd or 3rd day and tumor volumes were plotted as indicated. The data represent the average tumor volumes of 20 mice/control group and 8 mice/ES-exo/GM-CSF group and are representative of three independent experiments. Error bars represent mean ± SD. (d) Scatter plot showing tumor volume in individual mice measured at week 3 (n = 12 mice in control and ES-exo groups and 8 mice in ES-exo/GM-CSF group, mean ± SD, **, p < 0.001; ANOVA with Tukey’s multiple comparison test).
Figure 4. ESC-derived exosome vaccination induces Th1-mediated cytokine responses in splenic CD8+ T cells.
(a–c) C57BL/6 mice (n = 6 per group) were immunized twice (days 0 and 7) with vehicle only (HBSS control) or with exosomes isolated from vector control ES-D3 cells (ES-exo) or with exosomes isolated from ES-D3 cells over-expressing GM-CSF (ES-exo/GM-CSF) in the right flank. Ten days after the boost, mice were euthanized and spleens were removed. Splenocytes from vaccinated and control mice were co-cultured with LLC lysate (50 μg/mL) for an additional 4 days. Effector cells were then restimulated for 6 h with LLC lysate (50 μg/mL) in the presence of Brefeldin A (1 µL/mL of the culture medium). After restimulation, cells were harvested, Fc receptors were blocked, and stained for surface expression of CD3, CD8 and intracellular expression of cytokines and analyzed by flow cytometry. (a) Dot plots showing IFN-γ expression in CD8+ T cells in splenocyte cultures obtained from control, ES-exo- and ES-exo/GM-CSF-vaccinated mice. Numbers in quadrants represent the percentages of each subpopulation. (b, c) Bar graphs showing percentages of CD8+IFN-γ+, and CD8+TNF-α+ in splenocyte cultures derived from control, ES-exo- and ES-exo/GM-CSF-vaccinated mice. Results are expressed as percentages of total cells (n = 6 per group, mean ± SD, **, p < 0.001; ***, p < 0.0001; ANOVA with Tukey’s multiple comparison test). (d–f) ESC-derived exosome vaccination induces Th1-mediated cytokine response in splenic CD8+ T cells when stimulated with antigens expressed by several tumor cell lines. Splenocytes from vaccinated and control mice were co-cultured with B16-F10, MC-38, E0771 lysate at 50 μg/ml for 4 days. Effector cells were then restimulated for 6 h with B16-F10 cell lysate (50 μg/mL) (d), MC-38 cell lysate (50 μg/mL) (e), and E0771 lysate (50 μg/mL) (f), in the presence of Brefeldin A (1 µL/mL of the culture medium). After restimulation, cells were harvested, Fc receptors were blocked, and stained for surface expression of CD8 and intracellular expression of IFN-γ and analyzed by flow cytometry. (d–f) Bar graphs showing percentages of CD45+CD3+CD8+IFN-γ+ in splenocytes derived from control, ES-exo- and ES-exo/GM-CSF-vaccinated mice. Results are expressed as percentages of total CD45+ cells (n = 6 per group, mean ± SD, **, p < 0.001; ***, p < 0.0001; p = ns; ANOVA with Tukey’s multiple comparison test).
Figure 5. ESC-derived exosome vaccination induces Th1-mediated cytokine responses in intra-tumoral CD8+ T cells.
(a–c) C57BL/6 mice (n = 6 per group) were immunized twice (days 0 and 7) with vehicle only (HBSS control) or with exosomes from vector control ES-D3 cells (ES-exo) or with exosomes isolated from ES-D3 cells over-expressing GM-CSF (ES-exo/GM-CSF) in the right flank prior to s.c. challenge with LLC on day 14. Mice were euthanized 15–18 days after tumor challenge, tumors were removed and enzymatically digested. Tumor-infiltrating cells from vaccinated and control mice were stimulated with LLC lysate (50 μg/mL) for 24 h. Cells were then restimulated for 6 h with LLC lysate (50 μg/mL) in the presence of Brefeldin A (1 µL/mL of the culture medium). After restimulation, cells were harvested, Fc receptors were blocked, and stained for surface expression of CD8 and intracellular expression of cytokines and analyzed by flow cytometry. (a) Dot plots showing IFN-γ expression in CD45+CD3+CD8+ cells in tumor-infiltrating cells obtained from control, ES-exo- and ES-exo/GM-CSF-vaccinated mice. Numbers in quadrants represent the percentages of each subpopulation. (b, c) Bar graphs showing percentages of CD45+CD3+CD8+IFN-γ+ (b) and CD45+CD3+CD8+TNF-α+ (c) in tumors derived from control, ES-exo- and ES-exo/GM-CSF-vaccinated mice. Results are expressed as percentages of total CD45+ cells (n = 6 per group, mean ± SD, *, p < 0.05 **, p < 0.001; ANOVA with Tukey’s multiple comparison test).
Figure 6. ESC-derived exosome vaccination decreases T regulatory (Treg) cells and increases the ratio of effector CD8+ T cells to Treg in the tumors.
C57BL/6 mice (n = 4 per group) were immunized twice (days 0 and 7) with vehicle only (HBSS control) or with exosomes from vector control ES-D3 cells (ES-exo) or with exosomes isolated from ES-D3 cells over-expressing GM-CSF (ES-exo/GM-CSF) in the right flank prior to s.c. challenge with LLC on day 14. Mice were euthanized 15–18 days after tumor challenge, tumors were removed, enzymatically digested, and tumor-infiltrating cells were harvested from control and vaccinated mice and analyzed by flow cytometry. (a) Dot plots showing the percentages of CD3+CD4+Foxp3+ Tregs in CD45+ tumor-infiltrating cells obtained from control, ES-exo- and ES-exo/GM-CSF-vaccinated mice. Numbers in quadrants represent the percentages of each subpopulation. (b) Bar graphs showing the percentages of CD3+CD4+Foxp3+ Tregs sub-populations in CD45+ tumor infiltrating cells from control, ES-exo- and ES-exo/GM-CSF-vaccinated mice. Results are expressed as percentages of total CD45+ cells (n = 4 per group, mean ± SD, *, p < 0.05; ANOVA with Tukey’s multiple comparison test). (c) Bar graph showing the ratio of CD8+ Foxp3 – to CD8–Foxp3+ cells in one of two representative experiments (n = 4 per group, mean ± SD, *, p < 0.05; ANOVA with Tukey’s multiple comparison test). (d) ESC-derived exosome vaccination increases the frequency of functional CD8+ T cells in tumors. Bar graph showing the percentages of CD25+CD8+ in CD45+ tumor-infiltrating cells obtained from control and ES-exo/GM-CSF-vaccinated mice. Results are expressed as percentages of total cells. The data represent results from two independent experiments with three mice/group. *, p < 0.05; relative to control group; unpaired t test. Error bars represent mean ± SD. (e) ESC-derived exosome vaccination increases myeloid-derived suppressor cells (MDSCs) in the tumors. Bar graphs showing the percentages of CD11b+Gr-1+ MDSCs sub-populations in CD45+ tumor infiltrating cells. Results are expressed as percentages of total CD45+ cells (n = 4 per group, mean ± SD, *, p < 0.05; ANOVA with Tukey’s multiple comparison test). (f, g) Bar graphs showing the percentages of CD11b+Gr-1–CD11c+ dendritic cells (f) and percentages of CD11b+Gr-1–F4-80+ macrophages (g) in CD45+ tumor-infiltrating cells obtained from control, ES-exo- and ES-exo/GM-CSF-vaccinated mice. (n = 4 per group, mean ± SD, p = ns; ANOVA with Tukey’s multiple comparison test).
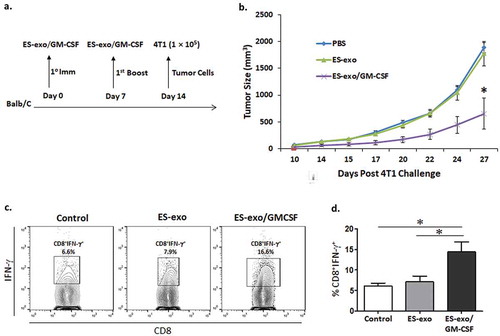
Figure 7. ESC-derived exosome vaccination slows the outgrowth of an implanted mammary carcinoma.
(a) Scheme of immunization. Female Balb/c mice were immunized twice (days 0 and 7) with vehicle only (HBSS control) or with exosomes from vector control ES-D3 cells (ES-exo) or with exosomes isolated from ES-D3 cells over-expressing GM-CSF (ES-exo/GM-CSF) in the right flank prior to s.c. challenge with syngeneic 4T1 cells on day 14. (b) Tumor growth was measured with calipers every second or third day and tumor volumes were plotted as indicated. The data represent the average tumor volumes of 20 mice/group. Error bars represent mean ± SD. (c, d) ESC-derived exosome vaccination induces Th1-mediated cytokine responses in splenic CD8+ T cells. Splenocytes from vaccinated and control mice were co-cultured with 4T1 lysate (50 μg/ml) for an additional 4 days. Effector cells were then restimulated for 6 h with 4T1 lysate (50 μg/mL) in the presence of Brefeldin A (1 µL/mL of the culture medium). After restimulation, cells were harvested, Fc receptors were blocked, and stained for surface expression of CD8 and intracellular expression of IFN-γ and analyzed by flow cytometry. (c) Dot plots showing IFN-γ expression in CD8+ cells in splenocyte cultures obtained from control, ES-exo and ES-exo/GM-CSF vaccinated mice. Numbers in quadrants represent the percentages of each subpopulation. (d) Bar graphs showing percentages of CD8+IFN-γ+ in splenocyte cultures derived from control, ES-exo and ES-exo/GM-CSF vaccinated mice. Results are expressed as percentages of total cells (n = 4 per group, mean ± SD, *, p < 0.05; ANOVA with Tukey’s multiple comparison test).