Figures & data
Figure 1. Workflow of the project.
Scheme of the project workflow and the main techniques used: 1) reactivity of antibodies from patients’ ascitic fluids against OC antigens was initially tested using a small group of samples, on two OC cell lines, by Western blot, ELISA, and immunofluorescence. 2) Antigens were identified by performing rounds of selection of an Open Reading Frame (ORF) fragments library displayed on the filamentous phage. Selection was performed with Igs from seven OC ascites. 3) Reactivity against selected putative antigens was further verified by protein microarray on 13 OC, two noncancerous, and two control samples. 4) Antigenicity validation was done by ELISA using the whole cohort of 153 ascites samples. 5) Clinical correlation of novel putative antigens to antibody titer and gene expression was performed, both on internal and external datasets.
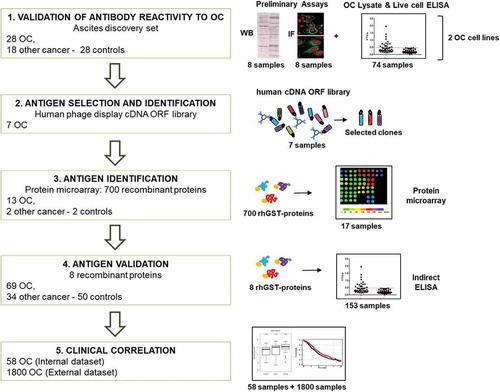
Table 1. Clinicopathological characteristics of patients included in the study.
Figure 2. Antibodies from OC ascitic fluids react with tumor cells.
(a) Western blot of lysates from OVCAR-3 (upper panel) and SKOV-3 (lower panel) cells. Each sample was incubated with equal amount of Igs purified from ascites from OC patients (a-d) or from noncancerous controls (e-h). Immunoreactivity was detected with HRP-conjugated anti-human secondary antibody. After detection of ascitic IgG immunoreactivity, the membranes were stripped and probed with anti-α-tubulin antibody to assess the loading of lysate among the samples. (b) Immunofluorescence of OVCAR-3 and SKOV-3 cells with Igs purified from ascites. The cellular localization of TAAs was detected with Cy5-conjugated anti-human IgG (green). Nuclei were stained with propidium iodide (red). (a-d) Representative images of OVCAR-3 cells incubated with (a-c) Igs from OC ascites (a) without cell permeabilization, showing surface staining; (b) after cell fixation, showing nuclear staining; and (c) after permeabilization, showing cytoplasmic staining; (d) image of fixed and permeabilized OVCAR-3 cells incubated with Igs from noncancerous controls, showing a lack of any detectable signal. (e, f) Immunofluorescence analysis of fixed and permeabilized SKOV-3 cells incubated with Igs from ascites from patients with (e) OC and (f) noncancerous conditions, confirming the difference in reactivity.
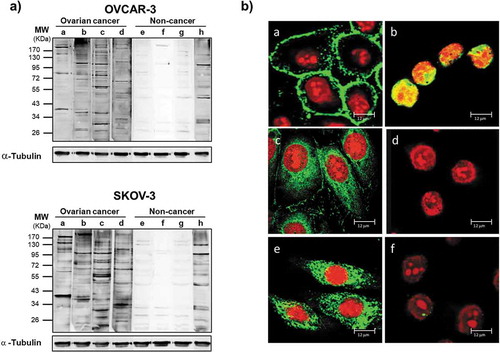
Figure 3. Antibodies from OC ascitic fluids react with tumor cells.
(a) OC whole-cell ELISA. Fixed and permeabilized OVCAR-3 or SKOV-3 cells at 80% confluence were incubated with 20 µg/ml Igs purified from ascites from patients with OC, other cancers or noncancerous conditions. (b) ELISA of OC cell lysate. OVCAR-3 or SKOV-3 cell lysates were prepared under nondenaturing conditions and used to coat the microtiter plates, which were subsequently incubated with 20 µg/ml Igs purified from ascites from patients with OC, other cancers or noncancerous conditions. Dotted lines represent cut-off levels calculated as the cumulative mean of the arbitrary units (AU) from noncancerous control wells. Light gray shaded areas indicate positive OC samples. Groups were compared by two-tailed unpaired t-test, and p-values are reported. p-Value<0.05 is considered significant.
Table 2. List of identified antigens.
Figure 4. Validation of antigenic protein recognition by ELISA.
Each antigen was challenged with a 1:50 dilution of Igs purified from ascites from patients with OC, other cancers or noncancerous conditions. Immunoreactivity was assessed by measuring the amount of bound secondary anti-human IgG antibody and expressed as AU. Dotted lines represent cut-off levels. Differences between groups were calculated using Fisher’s exact test, and p-values are indicated. Difference was considered significant for a p-value<0.05.
Figure 5. Antibody titer and correlation to clinical data.
OC patients were stratified in three groups according to their response to platinum-based treatment: ‘resistant’ (28 patients); ‘partially sensitive’ (16 patients) and ‘sensitive’ (24 patients). (a) Immunoreactivity in the different patients’ subgroups for BCOR, CREB3, and MRPL46; the values are expressed as AU. (b) immunoreactivity for the antibody signature comprising the combination of BCOR, CREB3 and MRPL46 signals in the different patient subgroups; the 3-gene signature is defined as the mean of the normalized values of the ELISA signal of the three genes. (c) p-values referring to ELISA signal comparisons for reactivity against the eight antigens or for the 3-protein signature between resistant vs. partially sensitive or resistant vs. sensitive patients (Mann–Whitney test). Statistically significance values are indicated in bold.
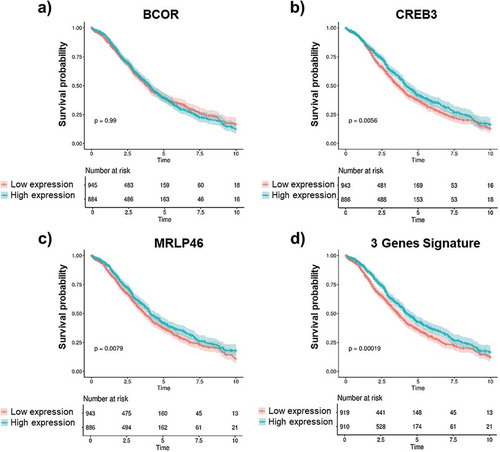
Figure 6. Gene expression and OS correlation.
Kaplan-Meier analysis of overall survival (OS) of OC patients according to the normalized mean expression of the genes of interest categorized as low (red lines) or high (blue lines). Gene expression levels of BCOR, CREB3, MRPL46 as well as the combined gene signature of these three antigens were measured in OC patients with 10 y of follow-up data. BCOR gene expression (a) shows no correlation with OS (y). Higher gene expression of CREB3 (b) and MRLP46 (c) is significantly associated with longer OS time (y). A much higher correlation was observed for combined signature of the expression data for all three genes as a novel gene signature (d). Log-rank p-values are reported. Shaded colors represent confidence intervals.