Figures & data
Figure 1. RAGE is required for neutrophil cytotoxicity.
a. Western blot analysis of doxycycline-induced (Dox.) sRAGE expression in the supernatant of AT3, LLC and E0771 cells. b. Killing of sRAGE-expressing AT3, LLC and E0771 cells by neutrophils. n = 5. c. Killing of AT3, LLC, E0771 and B16-F10 by neutrophils in co-culture in the presence of control or RAGE blocking antibody (1 μg/ml; R&D, AF1179). n = 6–9. d. Flow cytometry of RAGE expression on neutrophils (red). Black histogram represents the 2nd antibody only. e. Flow cytometry of blood from mice transplanted with wild-type (WT) or RAGE-/- bone marrow, showing full reconstitution of GFP+/Ly6G+/RAGE-/- neutrophils (>90% GFP positive cells). f. RT-PCR of RAGE mRNA in neutrophils (Neut.) and bone marrow (BM) isolated from wild-type and RAGE-/- mice. g. Western blot analysis of RAGE expression in lung lysates from wild-type and RAGE-/- mice. h. Killing of AT3 and LLC cells by neutrophils purified from tumor-bearing wild-type and RAGE-/- mice. n = 6. i. Killing of AT3 and LLC tumor cells by neutrophils purified from tumor-bearing wild-type or RAGE-/- bone marrow-transplanted (BMT) C57BL/6 mice. n = 7-12. j. Primary tumor growth of AT3 cells following orthotopic injection into wild-type or RAGE-/- mice. n = 5. k. Primary tumor growth of AT3 cells following orthotopic injection into mice transplanted with either wild-type or RAGE-/- bone marrow cells. n = 5. l. Primary tumor growth of orthotopically injected AT3 tumors expressing tet-inducible sRAGE in wild-type mice in the absence (Cont.) or presence of doxycycline (sRAGE) in the drinking water. The ratio of AUCsRAGE/AUCControl = 2.17. n = 5. m. MTT assay (OD 540nm) for in vitro proliferation of tet-inducible sRAGE expressing AT3 cells in the absence or presence of doxycycline. n = 6. *p <0.05, **p < 0.001.
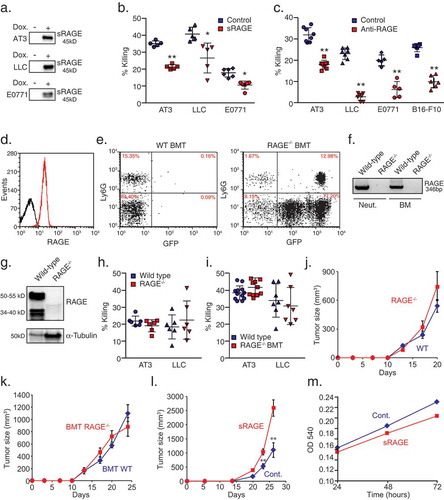
Figure 2. Tumor-cell RAGE is required for neutrophil cytotoxicity.
a. RT-PCR analysis of RAGE isoform 1 expression (exons 8–9) in various mouse tumor cell lines, neutrophils (Neut.) and bone marrow cells (BM). b. Western blot analysis for RAGE expression in 4T1, AT3, and LLC cells using antibodies to N-terminal RAGE (clone A-9, Santa Cruz, RAGE-N), C-terminal RAGE (ab3611, Abcam, RAGE-C) or total RAGE (R&D, AF1179). Antibodies to β-actin were used as loading control. c. qPCR analysis of RAGE expression in AT3 and LLC cells transduced with shRNA to RAGE. d. Killing of AT3 and LLC cells transduced with pLKO-scrambled or pLKO-RAGE shRNA by neutrophils. n = 8–10. e. Illustration of CRISPR targeting of RAGE (CRISPR N/C) and the two primer sets used for genomic analysis (F1/R1, F2/R2). f. Genomic PCR analyses of AT3 and LLC CRISPR clones using the primer sets F1/R1 and F2/R2. g. RT-PCR of RAGE mRNA in control AT3 cells and three CRISPR clones using primers for exons 3–5. h-i. Neutrophil killing of control (RAGE+/+), RAGE+/- and RAGE-/- AT3 (h) and LLC cells (i). n = 5–6. * p <0.05, ** p <0.001.
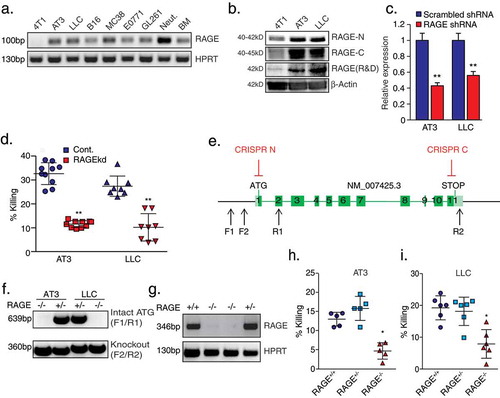
Figure 3. Soluble RAGE-Fc binds strongly to tumor cells and forms homophilic RAGE–RAGE interaction.
a. Western blot analysis of tet-inducible sRAGE-Fc expression (Dox.) in the supernatant of AT3 and LLC cells. b. Killing of tet-inducible sRAGE-Fc-expressing AT3 and LLC tumor cells by neutrophils with or without doxycycline (Dox.) induction. n = 5–9. c. Flow cytometry analysis of sRAGE-Fc binding to AT3 and LLC cells. The black histogram represents the 2nd antibody only. d. Flow cytometry analysis of sRAGE-Fc binding to neutrophils (Red histogram). The black histogram represents the 2nd antibody only. e. Co-immunoprecipitation of endogenous RAGE with sRAGE-Fc. Lysates of control and sRAGE-Fc overexpressing AT3 cells were incubated with Protein A-beads, and the co-immunoprecipitated proteins analyzed by Western blotting. Antibody to Fc detects the higher MW sRAGE-Fc band, while anti-RAGE detects both sRAGE-Fc (75–95 kD) and endogenous Rage (34–55 kD). Antibody to α-Tubulin was used for loading control, and can only be detected in Pre-IP samples. Pre-IP presents 1/50 of the input IP sample. The samples were run under reducing conditions. f. Summary of mass spectrometry analysis of neutrophil proteins interacting with AT3-derived sRAGE-Fc. g. RT-PCR of S100A8, S100A9 and TBP in neutrophils and bone marrow. h. Left lane is Pierce blue staining of neutrophil extract run on SDS-PAGE gel. The middle and right lanes are Western blotting for S100A8 and S100A9 expression, respectively, in the same neutrophil extract. i. Co-immunoprecipitated neutrophil proteins were analyzed by Western blotting using antibodies to S100A8, S100A9 or Fc to detect sRAGE-Fc. The three first lanes represent Pre-IP samples that were loaded 1/50 of the input IP sample. Neut. = Neutrophils; Cont. = Control AT3 cells; sRAGE-Fc = AT3 cells expressing sRAGE-Fc. The samples were run under reducing conditions. ** p <0 .001.
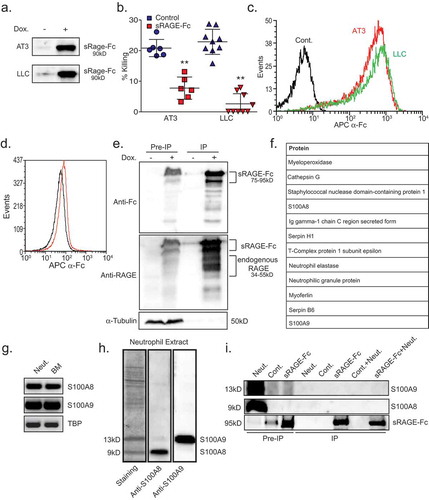
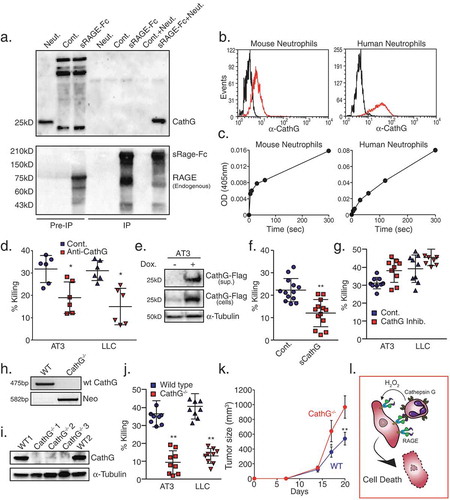
Figure 4. Neutrophil Cathepsin G recognizes tumor cells by interacting with tumor RAGE.
a. Co-immunoprecipitation of neutrophil proteins with AT3-derived sRAGE-Fc. Co-immunoprecipitated neutrophil proteins were analyzed by Western blotting using antibodies to Cathepsin G (Upper panel) or RAGE (Lower panel) to detect sRAGE-Fc (upper band) and endogenous RAGE (lower band). The three first lanes represent Pre-IP samples that were loaded 1/50 of the input IP sample. Neut. = Neutrophils; Cont. = Control AT3 cells; sRAGE-Fc = AT3 cells expressing sRAGE-Fc. The samples were run under non-reducing conditions. b. Flow cytometry of surface Cathepsin G expression on mouse and human neutrophils (red histograms). Black histograms represent the 2nd antibody only. c. Surface Cathepsin G activity measured at 405nm after adding the Cathepsin G substrate MeOSuc-Ala-Ala-Pro-Met-pNA (200 μM) to 1 × 10⁵ neutrophils. d. Killing of AT3 and LLC cells by neutrophils in the presence of control or anti-Cathepsin G antibodies (1 μg/ml). n = 6. e. Western blot analysis of Cathepsin G-Flag expression in supernatant (“sup.”) and in AT3 cells that overexpress tet-inducible Cathepsin G-Flag. f. Killing of Cathepsin G-Flag-overexpressing AT3 tumor cells by neutrophils with or without doxycycline (Dox.) induction. n = 13. g. Killing of AT3 and LLC tumor cells by neutrophils in the absence or presence of 10 μM Cathepsin G inhibitor. n = 9. h. Genotyping of white blood cells isolated from mice transplanted with either wild-type (WT) or Cathepsin G-/- (CathG-/-) bone marrow cells using primers for Cathepsin G and Neomycin (Neo). i. Western blot analysis of white blood cells from mice reconstituted with either wild-type or Cathepsin G−/- bone marrow cells. j. Killing of AT3 and LLC tumor cells by wild-type or Cathepsin G-/- neutrophils. n = 9. k. Growth of AT3 tumors in mice transplanted with either wild-type or Cathepsin G-/- bone marrow cells. n = 5. The ratio of AUCCathG-/-/AUCWT = 1.63. l. Proposed model for neutrophil cytotoxicity towards RAGE-expressing tumor cells. Tumor cells attract neutrophils, which express Cathepsin G on their cell surface. The neutrophil Cathepsin G recognizes the tumor cells by interacting with their RAGE. Following neutrophil recognition of tumor cells, the tumor cells die by the well-characterized H2O2-dependent cell death mechanism exerted by the neutrophils. * p <0.05, ** p <0.001.