
Figures & data
Figure 1. Tumoral and non-tumoral PD-L1 expression is positively correlated with the numbers of CD8+ and PD-1+ TILs. (a) Representative IHC images of PD-L1, PD-1, and CD8. PD-L1 was expressed on tumor cells (A-1–4) and surrounding non-tumoral cells, primarily macrophages (A-5), concurrently or alone. CD8 and PD-1 were expressed on TILs (A-6–7), and PD-1 was expressed on tumor cells (A-8). Percentages of PD-L1+ cells of the tumor cells (tPD-L1, red bar) and those of PD-L1+ cells of the total cellularity including tumor cells and non-tumor cells (tmPD-L1, green bar) in each case are displayed (b). The correlation between the numbers of CD8+ TIL and PD-1+ TIL were assessed by Spearman correlation analysis (c). Numbers of CD8+ TILs and PD-1+ TILs in tPD-L1– and tPD-L1+ cases (d) and tmPD-L1 – and tmPD-L1+ cases (e). Differences were analyzed using the Mann-Whitney U test. Whiskers, 10th to 90th percentiles; midline of the box, median; +, mean. Points below and above the whiskers are individual points. Abbreviations: MΦ, macrophage; N, negative; P, positive.
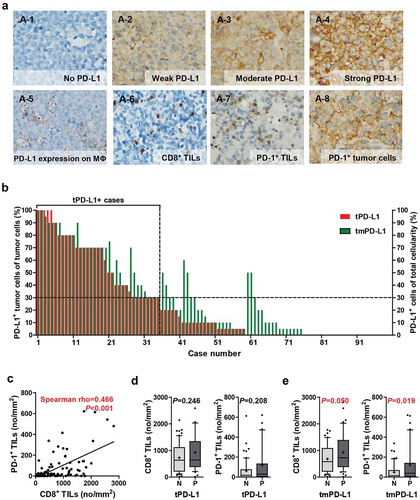
Table 1. Clinicopathological characteristics of patients with PCNS-DLBCL.
Figure 2. PD-L1 expression according to clinicopathological parameters. The percentages of tumoral PD-L1 (tPD-L1) and tumoral plus non-tumoral PD-L1 (tmPD-L1) were compared according to age (≤50, n = 21; >50, n = 77) (a), ECOG performance status (0–1, n = 61; 2–4, n = 36) (b), MSKCC class (class 1, n = 18; class 2, n = 68; class 3, n = 11) (c), MYC expression (<40, n = 78; ≥40, n = 20) (d), BCL2 expression (<60, n = 41; ≥60, n = 57) (e), and MYC/BCL2 expression status (NE, n = 37; SE, n = 45; DE, n = 16) (f). Differences were analyzed using Mann–Whitney U test and Kruskal–Wallis test and multiple test correction were done by Benjamini and Hochberg method. Adjusted P values were presented on graphs. Whiskers, 10th to 90th percentiles; midline of the box, median; +, mean. Points below and above the whiskers are individual points. Abbreviations: DE, double expresser; ECOG, Eastern Cooperative Oncology Group; MSKCC, Memorial Sloan Kettering Cancer Center; NE, non-expresser; SE, single expresser.
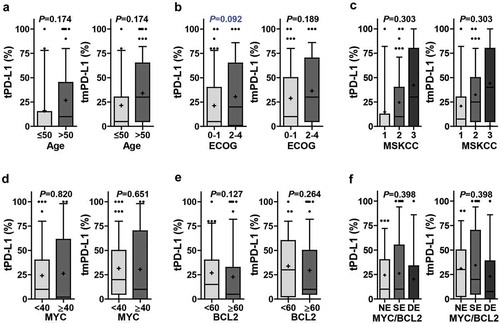
Figure 3. Numbers of CD8+ TILs and PD-1+ TILs according to clinicopathological parameters. The numbers of CD8+ TILs were compared according to age (≤50, n = 21; >50, n = 75) (a), ECOG performance status (0–1, n = 60; 2–4, n = 35) (b), MSKCC class (class 1, n = 18; class 2, n = 66; class 3, n = 11) (c), MYC expression (<40, n = 76; ≥40, n = 20) (d), BCL2 expression (<60, n = 40; ≥60, n = 56) (e), and MYC/BCL2 expression status (NE, n = 36; SE, n = 44; DE, n = 16) (f). The numbers of PD-1+ TILs were compared according to age (≤50, n = 19; >50, n = 71) (a), ECOG performance status (0–1, n = 57; 2–4, n = 32) (b), MSKCC class (class 1, n = 16; class 2, n = 64; class 3, n = 9) (c), MYC expression (<40, n = 72; ≥40, n = 18) (d), BCL2 expression (<60, n = 38; ≥60, n = 52) (e), and MYC/BCL2 expression status (NE, n = 35; SE, n = 40; DE, n = 15) (f). Differences were analyzed using Mann–Whitney U test and Kruskal–Wallis test and multiple test correction were done by Benjamini and Hochberg method. Adjusted P values were presented on graphs. Whiskers, 10th to 90th percentiles; midline of the box, median; +, mean. Points below and above the whiskers are individual points. *P< .05. Abbreviations: DE, double expresser; ECOG, Eastern Cooperative Oncology Group; MSKCC, Memorial Sloan Kettering Cancer Center; NE, non-expresser; SE, single expresser.
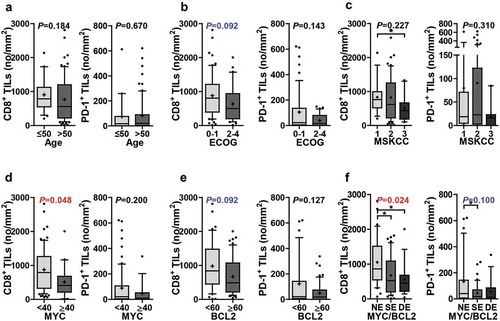
Figure 4. Prognostic significance of tPD-L1, CD8+ TILs, and PD-1+ TILs. Kaplan-Meier analysis of PFS and/or OS according to tPD-L1(tPD-L1-, n = 63; tPD-L1+ = 35) (a-b), CD8+ TILs (Low CD8+ TILs, n = 42; High CD8+ TILs, n = 54) (c), PD-1+ TILs (Low PD-1+ TILs, n = 44; High PD-1+ TILs, n = 46) (d), tPD-L1 plus CD8+ TILs (tPD-L1-/Low CD8+ TILs, n = 27; tPD-L1-/High CD8+ TILs, n = 34; tPD-L1+/Low CD8+ TILs, n = 15; tPD-L1+/High CD8+ TILs, n = 20) (e-f), and tPD-L1 plus PD-1+ TILs (tPD-L1-/Low PD-1+ TILs, n = 31; tPD-L1-/High PD-1+ TILs, n = 29; tPD-L1+/Low PD-1+ TILs, n = 13; tPD-L1+/High PD-1+ TILs, n = 17) (g-h). Differences in survival were analyzed by log-rank test. † P= .05–0.1, *P< .05.
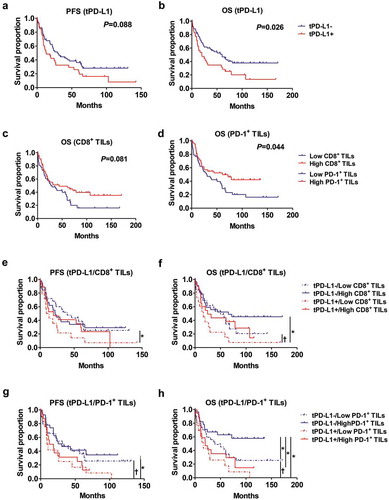
Table 2. Multivariate analysis of overall survival (OS) in patients with PCNS-DLBCL.