Figures & data
Table 1. Patient sample characteristics.
Figure 1. Clusterin expression in luminal breast cancer samples. A and B. Clusterin expression was analyzed by immunohistochemistry in tumoral (a) and juxtatumoral (b) tissues. Representative pictures are shown (n = 3, bars: 50 µm). C. Clusterin expression was quantified in tumor samples and their juxtatumoral counterparts by ELISA. Results are expressed as the amount of clusterin/total protein (µg of clusterin/mg of total protein, n = 21, ns = no statistically significant differences, p = .31).
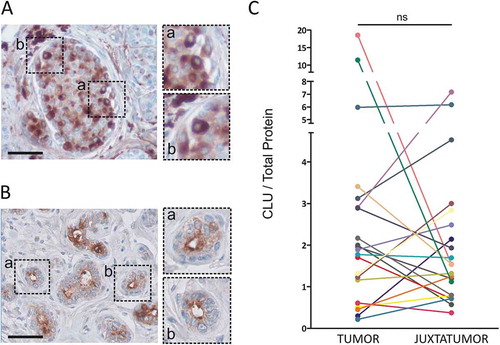
Figure 2. Fucosylated clusterin (fCLU) is expressed in luminal breast cancer and interacts with DC-SIGN. a. Scheme of the ELISA assay used to detect fucosylated clusterin. Clusterin is captured by a mAb directed to clusterin and the presence of fucosylated clusterin (fCLU) is revealed by using either biotinilated Ulex europaeus agglutinin-I lectin (UEA-I) or Lotus tetragonolobus lectin (LT). b. Fucosylated semen clusterin, but not serum or recombinant clusterin (blue bars), was detected by the assay described in (a). The addition of α-L-fucose prevents the recognition of fucosylated semen clusterin (red bars). Results are expressed as the mean ± SD of 4 independent experiments. c and d. Fucosylated clusterin expression in breast tumor and juxtatumoral samples (n = 14–21) was analyzed using Lotus tetragonolobus lectin (c) or Ulex europaeus agglutinin-I (d). Results are expressed as the amount of fucosylated clusterin relative to the amount of total clusterin (left panels) or total protein (right panels) (***p < .001, **p < .01, *p < .05). E. The ability of clusterin from tumor samples and juxtatumoral samples to bind to DC-SIGN was evaluated. Upper panel: the presence of clusterin was evaluated using a mAb directed to clusterin. Lower panel: the membrane was stripped and revealed using DC-SIGN-huFc and HRP conjugated anti-huIgG. Of note, total clusterin but not total protein was used to normalize the amount of sample loaded into the gel for each tumor and juxtatumor sample pair. Accordingly, no loading control was analyzed. Panel F shows the ratio between DC-SIGN-huFC binding and total CLU. The fold change between tumor and juxtatumor CLU ratios are shown.
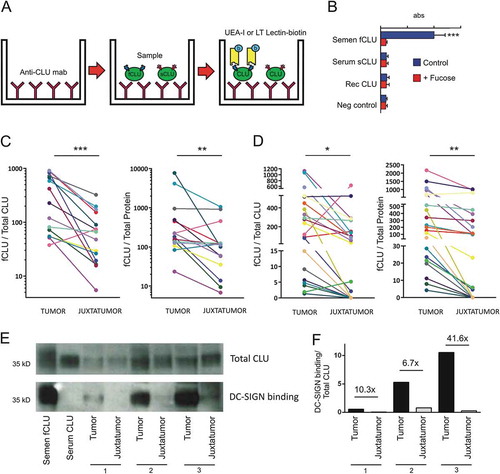
Figure 3. Single-cell analysis in breast cancer. Unsupervised principal component analysis (PCA) on the transcriptome of single-cell profiles (dots) colored by donor (a), cell tumor state (b) and cell type (c) showing the separation between tumor and non-tumor cells. D. Clusterin expression is dominant tumor cells. Unsupervised PCA of single-cell profiles with coloring of clusterin expression. E. Violin plots comparing clusterin expression based on cell types. Red lines show median expression for each group. P-values computed are pairwise Wilcoxon rank sum test comparing clusterin expression in tumor cells and other groups (*** = p < .001). F. Co-expression of Fucosyltransferases I, II, III and XI (FUT1, FUT2, FUT3 and FUT11) with clusterin in tumor cells is shown by PCA of single-cell profiles, showing clusterin expre ssion (red), FUT expression (green) and co-expression (yellow) or non-expression (black) of clusterin and FUTs.
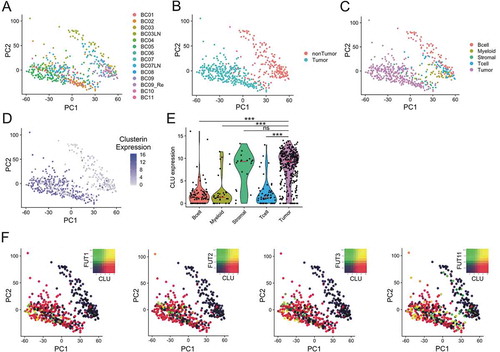
Figure 4. DC-SIGN expression by tumoral macrophages. a. Gating strategy used to identify the different populations of DCs and macrophages in tumoral and juxtatumoral samples. CD45+, lineage negative (CD3, CD19, CD56) and HLA-DR+ cells were gated and four different populations of DCs were identified: CD11c- CD123+ plasmacytoid pre-DCs (PDC), CD11c+ BDCA1+ CD14- DCs (BDCA1+), CD11c+ BDCA1- CD14- DCs (BDCA1-), and CD11c+ BDCA1+ CD14+ inflammatory DCs (CD14+ DC). Macrophages were identified as CD11c+ BDCA1- CD14+ cells (MAC). b. The four populations of tumoral DCs and tumoral macrophages were sorted, and the expression of DC-SIGN mRNA was determined by RNA-seq (n = 6–10). c. Flow cytometry analysis of cell surface DC-SIGN expression by the different populations of DCs and macrophages from tumoral and juxtatumoral samples. A representative experiment (n = 5) is shown.
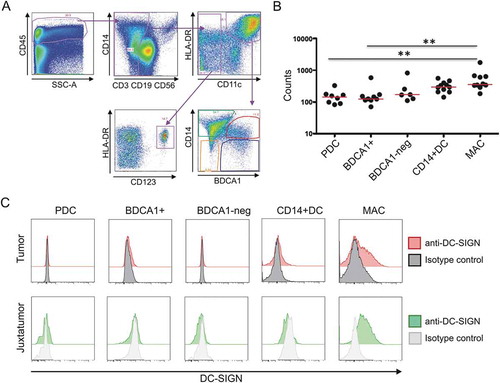
Figure 5. Fucosylated clusterin interacts with macrophages. a. Expression of DC-SIGN by monocyte-derived macrophages. A representative experiment (n = 7) is shown. b. Macrophages were incubated for 30 min at 4°C with different concentrations of fucosylated clusterin isolated from semen. Cells were then washed, lysed and the binding of clusterin was revealed by ELISA. Results are expressed as the mean ± SD of 4 independent experiments. c. Macrophages were incubated for 30 min at 4°C with fucosylated clusterin (10 µg/ml), in the absence or presence of a neutralizing mAb directed to DC-SIGN (5 µg/ml), lactose (100 µg/ml), sucrose (100 µg/ml), mannan (1–100 µg/ml), or α-L-fucose (1–100 µg/ml). Cells were then washed, lysed and the binding of clusterin was revealed by ELISA. Results are expressed as the mean ± SD of 3 experiments (**p < .01, *p < .05). d. Macrophages were incubated for 15 min at 37°C with fucosylated clusterin (10 µg/ml) and clusterin endocytosis (green) was analyzed by confocal microscopy (n = 5, bars:10µm).

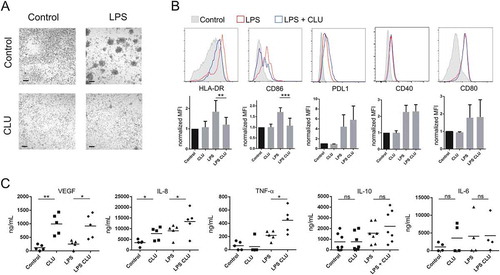
Figure 6. Fucosylated clusterin promotes the differentiation of macrophages into a proangiogenic profile. a-c. Macrophages were differentiated from monocytes cultured with M-CSF for 5 days, in the absence or presence of semen fucosylated clusterin. Then, cells were stimulated, or not, with LPS (10 ng/ml), and the pattern of cell clustering (a), the expression of HLA-DR, CD86, PDL-1, CD40 and CD80 (b), and the production of VEGF, IL-8, TNF-α, IL-10, and IL-6 (c) were evaluated by optical microscopy, flow cytometry or ELISA. Representative pictures (bars = 100µm) and histograms (n = 3–9) are shown in a and b. On b, the control condition mean fluorescent intensities (MFI) of each independent experiment were normalized as 1. The mean of 5–9 independent experiments is shown. The mean of 5–7 independent experiments is shown in c (**p < .01, *p < .05).