Figures & data
Figure 1. Ionizing radiation resulted in dose- and time-dependent G2/M cell cycle checkpoint activation.
(a), LLC cells were exposed to a single fraction of either low dose (2 Gy) or high dose (8 Gy) IR and assessed at 4, 8, 12, and 24 h after IR for cell cycle alterations by flow cytometry of DNA content. Representative data from one of at least two independent assays in technical triplicate shown. (b), quantification of cell cycle distribution of irradiated LLC, MOC1 and B16 cells following IR. Top panels quantify cells in the late S/G2/M gate, bottom panels quantify cells in the subG1 gate. (c), western blot analysis of p-cdc2 (Y15) and total cdc2 expression in LLC, MOC1 and B16 cells 8 h after exposure to a single fraction of 8 Gy IR with and without AZD1775 (250 nM) or DMSO (control). *, p < .05; **, p < .01; ***, p < .001 for all figures.
Figure 2. Wee1 kinase inhibition reversed G2/M cell cycle checkpoint activation resulting in M phase DNA damage and cell death.
(a), LLC cells were exposed to 8 Gy IR with and without AZD1775 (250 nm) for 8 h and assessed for cell cycle distribution using flow cytometry. Left panels demonstrate gating strategy based upon DNA content and EdU uptake during S phase. Right panels demonstrate G2 and M phase segregation based upon phosphorylation (S10) of HH3. Representative data from one of at least two independent assays in technical triplicate shown. (b), top panels demonstrate quantification of cell cycle phase distribution of LLC, MOC1 and B16 cells after treatment as in a. Some cells were exposed to exogenous nucleoside supplementation (1×). Bottom panels demonstrate quantification of DNA damage as measured by phosphorylation (S139) of γH2AX within each cell cycle phase. (c), Western blot analysis of LLC, MOC1 and B16 cells 8 h after exposure to 8 Gy IR with and without AZD1775 (250 nM). AZD, AZD1775; N, nucleoside supplementation.
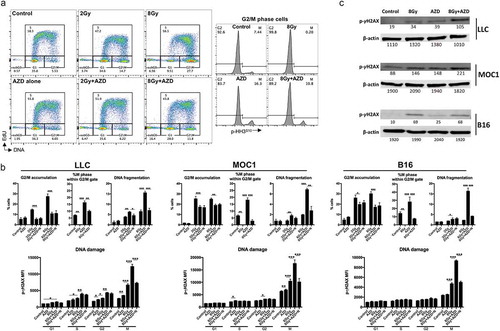
Figure 3. Concurrent Wee1 kinase inhibition and ionizing radiation produced the greatest loss of tumor cell viability.
(a), LLC cells were exposed to AZD1775 (250 nM) 24 h before (before IR), immediately after (concurrent) or 24 h after (after IR) a single fraction of 2 or 8 Gy IR and assessed for viability over time via impedance analysis. Some cells were exposed to nucleoside supplementation (1×). Schema of sequenced treatments on left, representative cell index impedance plots on right. (b), quantification at 48 h of change in impedance (cell index) for LLC, MOC1 and B16 cells with variable sequencing of AZD1775. C, LLC, MOC1 or B16 cells were treated with single fractions of IR, treated with concurrent AZD1775 (250 nM), and assessed for colony formation potential via clonogenic assays. Representative colony photographs on left, with quantification on right. Dashed lines correlate to radiation doses, with and without AZD1775, used to calculate the radiation enhancement ratio (RER). Representative data from one of at least two independent assays in technical triplicate shown.
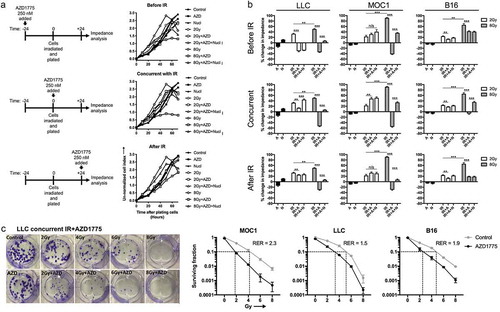
Figure 4. Combination ionizing radiation and Wee1 kinase inhibition enhances tumor growth control and survival over either treatment alone.
WT B6 mice bearing established (0.1 cm3) MOC1 tumors were treated with a single fraction of 8 Gy IR alone (d 14) or in combination with systemic AZD1775 (120 mg/kg daily for 10 d, starting at d 14). Cumulative results from two independent experiments shown. (a), individual tumor growth curves. (b), survival analysis.
Figure 5. On-target effects of Wee1 kinase inhibition were localized to tumors following ionizing radiation.
WT B6 mice bearing MOC1 tumors were treated at d 14 with a single fraction of 8 Gy IR and AZD1775 (120 mg/kg) at 1 and 24 h after IR. Four hours later (28 h after IR), tumors or oral mucosa from the same mice (n= 3/group) were assessed for cell lineage-specific intracellular phospho-γH2AX (S139) (a) or phospho-CDK1 (Y15) (b) in CD45.2−CD31−PDGFR− tumor cells, CD45.2−CD31−PDGFR+ fibroblasts, CD45.2−CD31+ endothelial cells or CD45.2+CD31− immune cells by flow cytometry. For A&B, representative dot plots or histograms shown on left, with quantification of phospho-γH2AX (a) or phospho-CDK1 (b) on the right. (c), MOC1 tumors (n= 3/time point) were exposed to a single dose of 8 Gy IR and a time course of TIL infiltration was assessed by flow cytometry. Representative dot plots on top, quantification of CD8+ and CD4+ TIL on bottom. (d), PD-1 expression on CD8+ TIL after IR was assessed by flow cytometry.
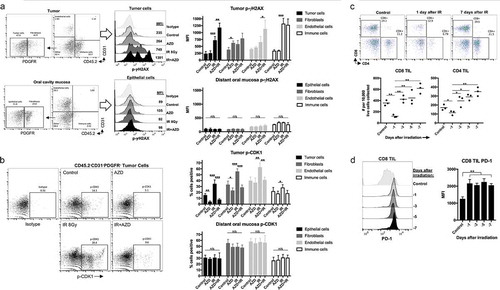
Figure 6. Combination ionizing radiation and Wee1 kinase inhibition enhance granzyme B-dependent CTL killing.
(a), SIINFEKL-expressing LLC, MOC1 or B16 cells were exposed to a single fraction of 8 Gy IR and AZD1775 (250 nM) alone or in combination and assessed for sensitivity to OT-I CTL killing (1:1 E:T ratio) via impedance analysis. Representative cell index impedance plots on left, with quantification of loss of cell index at 4 h on the right. (b), CTL killing following combination 8 Gy IR and AZD1775 was repeated in the presence and absence of concanamycin A (100 nM, OT-I CTL pre-treated for 4 h prior to addition to impedance assay). (c), G2/M block in tumor cells following exposure to granzyme B (3μg/mL)/streptolysin-O (40 ng/mL), AZD1775 (250 nM) and/or a single fraction of 8 Gy IR as detailed was assessed via flow cytometry 8 h after treatment. Representative dot plots from MOC1 cells shown on top and quantification of subG1 accumulation in MOC1, LLC and B16 cells on bottom. ConA, concanamycin A; GzmB, granzyme B; SLO, streptolysin-O.
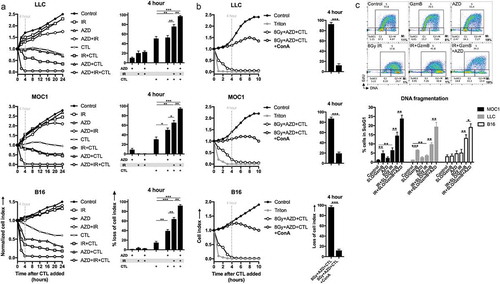
Figure 7. Ionizing radiation and Wee1 kinase blockade enhanced CD8+ cell-dependent responses to PD-1 ICB.
Established MOC1 tumors (0.1 cm3) were treated with combinations of 8 Gy IR alone (d 14), systemic AZD1775 (120 mg/kg daily for 10 d, starting at d 14) and PD-1 mAb (200 μg twice weekly for 2 weeks) as detailed. Cumulative results from two independent experiments shown. (a), individual tumor growth curves. (b), survival analysis. (c), control (WT B6) mice (n= 5) or mice cured following triple therapy (n= 11) were rechallenged in the contralateral flank at tumor d 100 with MOC1 cells (3e6 cells) and tracked for tumor growth. Forty days following challenge with MOC1, the same mice were rechallenged with MOC2 cells (1e5 cells) in the contralateral flank. (d), established MOC1 tumors were treated with triple therapy as in a, in the presence or absence of CD8, CD4 or NK depleting mAbs, and followed for tumor growth (n= 5/group). Established MOC1 tumors were treated with IR, AZD1775, and PD-1 mAb, alone or in combination, and CD3+ TIL sorted from tumor-draining lymph nodes were assessed for individual T-cell activation (CD44+Ki67+IFNγ+ by flow cytometry) (e) and cumulative IFNγ production (by ELISA) (f) following 48 h of exposure to MOC1 tumor antigen. APC alone refers to IFNγ-pretreated and irradiated MOC1 cells alone.