Figures & data
Figure 1. Polymicrobial sepsis inhibits malignant tumor growth in mice with cancer. (a) Sequential local model with s.c. inoculation of MCA205 cells (day 0) followed by CLP-induced polymicrobial sepsis or sham surgery at days 7 or 14. Tumor volumes (b and d) and absolute variations of tumor volumes (c and e) were measured 7 days after surgery (D7 + 7 or D14 + 7, respectively). n = 15–20 mice per group. (f) Sequential metastatic model with i.v. inoculation of MCA205 tumor cells (day 0) followed 14 days later by CLP-induced polymicrobial sepsis or sham surgery. The pulmonary tumoral spread was measured 7 days after surgery. (g) Representative India ink-colored lungs and hematoxylin-eosin-stained lung sections in sham- and CLP-operated mice previously subjected to i.v. inoculation of MCA205 cells. The tumoral surface of the right lung was assessed in 3 random sections from the same mouse (h) (n = 3 mice per group). *p < .05.
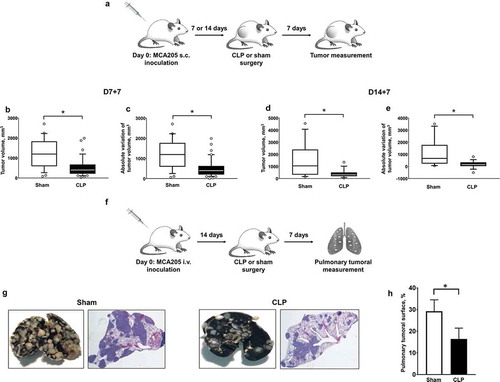
Figure 2. Characteristics of sepsis-induced anti-tumoral immune response. Mice were subjected to CLP or sham surgery 14 days after s.c. MCA205 inoculation. Tumors were removed at 24 hours following surgery. (a and b) Distribution of myeloid and lymphoid subsets among viable CD45+ hematopoietic cells within tumors from sham-operated (white, n = 11) and CLP-operated (black, n = 10) mice. T helper lymphocytes (Th) are CD4+CD25−. T regulatory cells (Treg) are CD4+CD25+. (c) Expressions of Prf1, Gzmb, Ifng, Tnf, Il10, Tgfb1, Il12a and Il12b were quantified by RT-qPCR within tumors from sham-operated (white, n = 8) and CLP-operated (black, n = 12) mice. (d) TNFA and IL10 protein levels within supernatants of tumor homogenates obtained from sham-operated (white, n = 7) and post-CLP (black, n = 7) mice. NRQ, normalized relative quantity; iDC, inflammatory dendritic cells; cDC, conventional dendritic cells; PMN, polymorphonuclear cells; Mono, monocytes/macrophages; iMono, inflammatory monocytes/macrophages; Th, T helper; Treg, regulatory T cells. *p < .05.
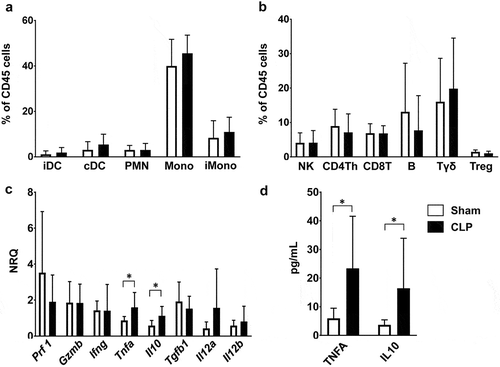
Figure 3. Sepsis-induced tumor growth inhibition is dependent on Tlr4 signaling. The sequential model of s.c. MCA205 inoculation followed by sham (white) or CLP (black) surgery at day 14 was applied to Tlr2−/- mice (n = 11 and 8 respectively), Tlr4−/- mice (n = 23 and 17 respectively), and MyD88−/- mice (n = 10 and 14 respectively). Tumor volumes (a) and absolute tumor variations (b) were measured 7 days after surgery. WT mice were subjected to s.c. MCA205 inoculation followed by PBS (white, n = 32), heat-killed Staphylococcus aureus (HKSA) (grey, n = 12) or LPS (black, n = 30) i.p. injection at day 14. Tumor volumes (c) and absolute tumor variations (d) were measured 7 days after i.p. injection. *p < .05.
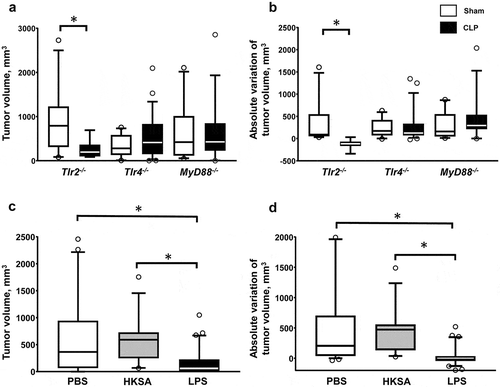
Figure 4. Tumor-associated NK subsets. (a) Major histocompatibility complex class 1 expression on MCA205 and YAC-1 cell lines and on splenocytes from naive mice (positive control) stained with anti-H2 antibody. (b–d) Mice were subjected to s.c. inoculation of MCA205 tumor cells followed followed 14 days later by a septic insult (sham surgery or CLP, or PBS or LPS i.p. challenge). Tumors were removed at 24 hours following the septic challenge to assess the distribution of intratumoral NK subsets based on CD11b and CD27 expressions (b) and the membrane expressions of NKG2D (c) and CD25 (d) on intratumoral NK cells. 6–11 mice/group from two independent experiments. MFI, median fluorescence intensity. *p < .05.
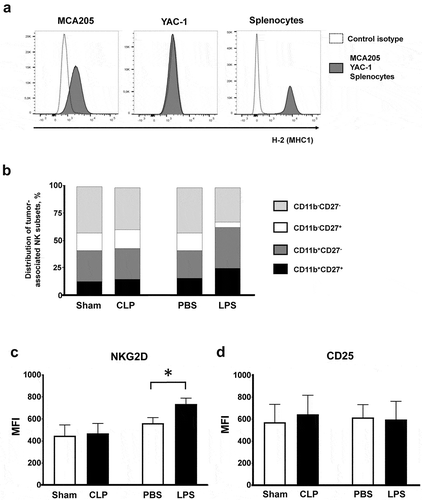
Figure 5. Functional role of tumor-associated NK cells in sepsis-induced tumor inhibition. Mice were subjected to s.c. inoculation of MCA205 tumor cells followed followed 14 days later by a septic insult (sham surgery or CLP, or PBS or LPS i.p. challenge). (a) Tumors were removed at 24 hours following the septic challenge for the assessment of intracellular expression of IFNγ, perforin, granzyme B and outer membrane expression of CD107a among tumor-associated NK cells. 6–11 mice per group from two independent experiments. *p < .05. (b) Mice were NK-depleted by i.p. injection of anti-NK1.1 antibody 24h before sham surgery (n = 9) or CLP (n = 12). Injection of anti-NK1.1 antibody was repeated once three days later. Tumor volumes were measured before (D14) and 7 days after surgery (D14 + 7). (c) Mice were NK-depleted by i.p. injection of anti-NK1.1 antibody 24h before PBS (n = 11) or LPS (n = 11) i.p. challenge. Injection of anti-NK1.1 antibody was repeated once three days later. Tumor volumes were measured before (D14) and 7 days after surgery (D14 + 7).
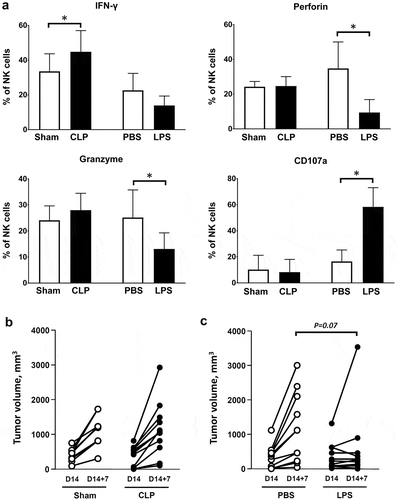
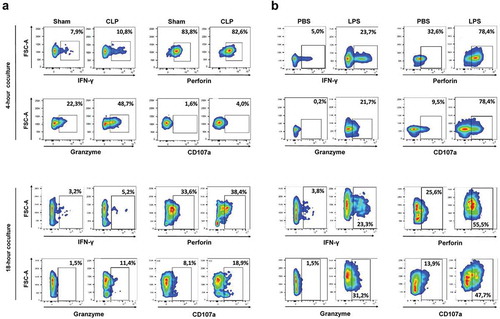
Figure 6. Sepsis enhances the NK cytotoxic functions towards MCA205 target cells. Mice were first s.c. inoculated with MCA205 cells, and then subjected to CLP or sham surgery (a), or to LPS or PBS challenge (b) 14 days after. Splenic NK cells pooled from 3 mice were purified at 24 hours following septic challenge, and co-cultured for 4 h and 18 h with MCA205 cells (effector-to-target ratio 1:1). Among NK cells, the intracellular expressions of IFNγ, perforin, granzyme B and the outer membrane expression of CD107a were quantified by flow cytometry. The figure is representative of two independent experiments.