Figures & data
Figure 1. Schematic representations and three-dimensional models of GRNLY and MFE23-GRNLY. The α-factor signal peptide is used to direct secretion of the recombinant proteins in P. pastoris, and the 6xHis tag is appended for immunodetection and affinity purification, respectively. Models were prepared by A. Blanco.
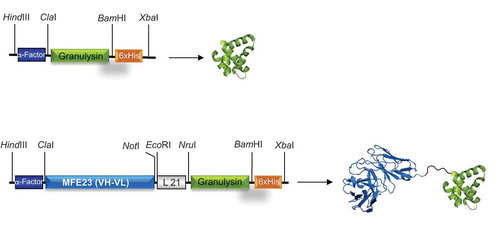
Figure 2. Characterization of purified MFE23-GRNLY immunotoxin. (a) Western blot of GRNLY, MFE23 and MFE23-GRNLY using an anti-His antibody. (b) Titration curves comparing the functionality of purified MFE23-GRNLY and MFE23 by ELISA against plastic immobilized CEA.
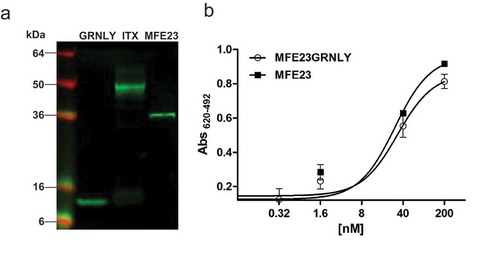
Figure 3. MFE23-GRNLY binding to CEA expressed on the cell surface. (a) HeLa, HeLa-CEA or HT-29 cells were stained with MFE23 or MFE23GRNLY, as indicated. Dark-gray histograms correspond to the negative controls. (b) Fluorescence images of HT-29 cells stained with (left) or without MFE23GRNLY (right), followed by mouse anti-His-tag and anti-mouse IgG-FITC antibodies. Nuclei were stained with Hoechst 33342.
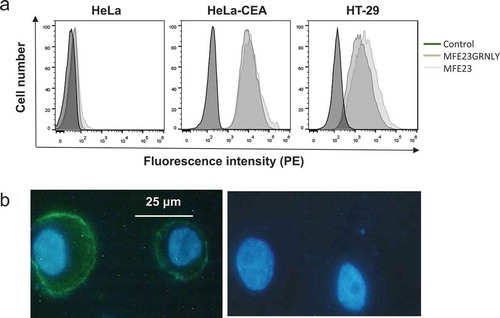
Figure 4. In vitro cytotoxicity of GRNLY and MFE23-GRNLY on HT-29 and HeLa-CEA cells. (a) HT-29 or HeLa-CEA cells were incubated with increasing concentrations of recombinant granulysin (black bars) or of the chimeric MFE23-GRNLY (white bars) during 24h. Cell growth was estimated using the MTT reduction method and results shown the percentage of the growth of control, untreated cells. (b) Apoptotic cell death induced by granulysin or by MFE23-GRNLY on HeLa-CEA cells was determined by detection of PS exposure by staining with Annexin-V-FITC and flow cytometry. (c) HeLa or HeLa-CEA cells were preincubated or not at 4ºC during 1 h with a supernatant containing MFE23, and then treated with 2 µM MFE23GRNLY during 24 h at 37ºC, as indicated. Results are the mean ± SD of at least 2 different experiments made in duplicate. **, P< .02; ***, P< .01.
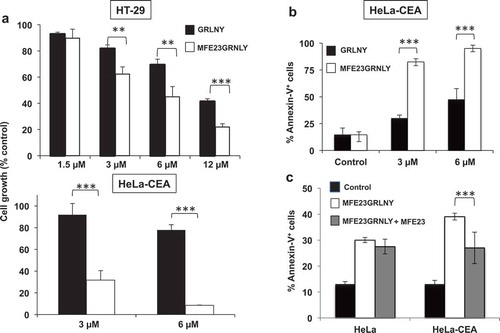
Figure 5. Granulysin or MFE23GRNLY intratumoral treatment of athymic mice bearing HT-29 cancer xenografts. (a) 2 × 10⁶ HT-29 colon carcinoma cells were injected s.c. in athymic mice. When tumor volume had arrived to 0.1 cm3, mice were divided in three groups, control (black squares), treated with recombinant granulysin (white triangles) or treated with MFE23GRNLY (white circles). Mice in each group received intratumoral injections of PBS, GRNLY or MFE23GRNLY, respectively, every 2 days for 10 times and two days later mice were sacrificed. Data are the mean±SD of the tumor volume in each group of the study. *, P < .05. (b) Tumor volumes after resection in the three experimental groups described in A. *, P < .05. (c) Tumor weights after resection in the three experimental groups described in A. *, P < .05.
Figure 6. Systemic treatment of athymic mice bearing HeLa-CEA cancer xenografts. (a) 3 × 10⁶ HeLa-CEA cells suspended in Matrigel were injected s.c. in athymic mice. When tumor volume had arrived to 0.175 cm3, mice were divided in three groups, control (black squares), treated with recombinant granulysin (white triangles) or treated with MFE23GRNLY (white circles). Mice in each group received intraperitoneal injections of PBS, GRNLY or MFE23GRNLY, respectively, every 2 days for 10 times and two days later mice were sacrificed. Data are the mean±SD of the tumor volume in each group of the study. *, P < .05; ***, P < .01. b and c. Tumor sizes (b) and tumor weights (c) after resection in the three experimental groups of the experiment shown in A. ***, P < .01.
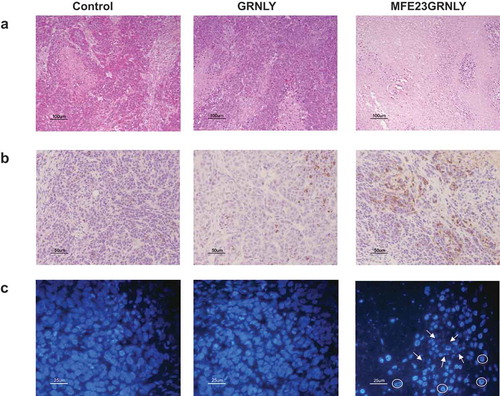
Figure 7. Histochemistry and immunohistochemistry in tissue sections of HeLa-CEA-derived tumors. (a) Representative images of H&E staining on sections form resected HeLa-CEA-derived tumors from the control group, from the granulysin-treated (GRNLY) or the MFE23GRNLY-treated groups of the experiment shown in Figure 7. (b) Tumor sections were incubated with an antibody against active caspase-3 and revealed by DAB staining. (c) Nuclei were stained using DAPI and photographed in a fluorescence microscope. Arrows indicate apoptotic, fragmented nuclei and circles indicate marginated chromatin nuclear phenotype.