Figures & data
Table 1. Distribution of clinicopathological characteristics in all patients and in strata according to neoadjuvant chemotherapy (NAC).
Figure 1. Immunohistochemical staining of CD8, FoxP3, CD20, PD-1 and PD-L1 in muscle invasive bladder cancer. Sample images (10x magnification with 40x insertion) of studied cell subsets in TURB specimens, cystectomy specimens and lymph node metastases (LN). The estimated percentage of stained cells was annotated. Arrow-heads illustrating a lymphoid aggregate of CD20+ B cells. Scale bar = 50 μm (10x) and 20 μm (40x).
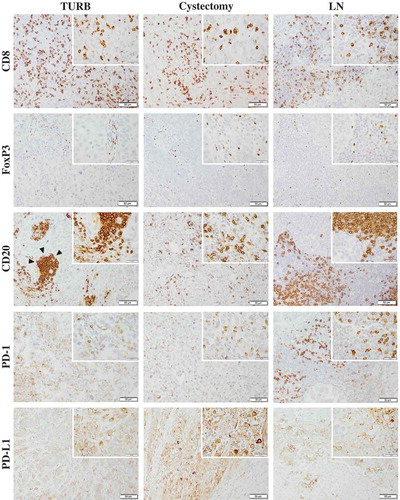
Figure 2. Distribution of immune marker expression in different types of specimens. Bar charts illustrating the distribution of different immune cell subsets and PD-L1TC in A) TURB specimens, B) cystectomy specimens and C) lymph node metastases.
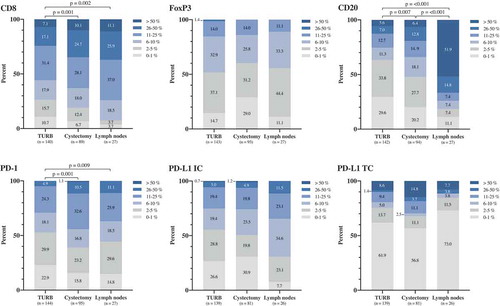
Figure 3. Distribution of immune cell density and PD-L1TC in strata according to neoadjuvant chemotherapy and histopathological response to treatment. A) Densities of different immune cell subsets in tissue specimens from NAC untreated (n = 80) and treated (n = 65) patients. B) Densities of different immune cell subsets prior to NAC treatment in complete (i.e. T-stage 0 or Ta/CIS) and non-complete (i.e. T-stage ≥1) responders. Whiskers represent 5% and 95%.
Figure 4. Clinicopathological correlates of different immune cell subsets and PD-L1TC. Box plots visualizing the associations between clinicopathological characteristics and immune marker density in A) TURB specimens and B) cystectomy specimens. Whiskers represent 5% to 95%. P-values are from non-parametric tests, only significant associations (p < .05) are denoted in the panels.
Table 2. Cox proportional hazards model for time to recurrence (TTR) in relation to clinicopathological factors and investigated immune cell markers and PD-L1TC.
Figure 5. Time to recurrence (TTR) according to the density of tumor-infiltrating immune cells and neoadjuvant chemotherapy. Kaplan-Meier estimates of TTR in combined strata according to high and low expression of CD8, FoxP3 and CD20 and neoadjuvant chemotherapy in A) TURB specimens and B) cystectomy specimens. Dichotomization into high and low expression was based on median values. Number at risk demonstrates the number of patients at risk of recurrence of muscle invasive bladder cancer at given time intervals during follow-up.
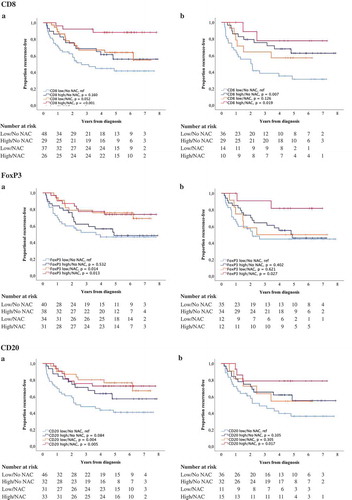
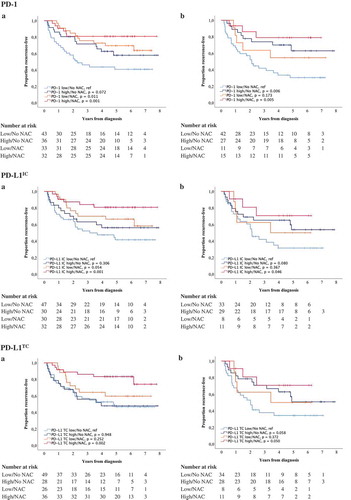
Figure 6. Time to recurrence (TTR) according to PD-1 and PD-L1 expression and neoadjuvant chemotherapy. Kaplan-Meier estimates of TTR in combined strata according to high and low expression of PD-1, PD-L1IC and PD-L1TC and neoadjuvant chemotherapy in A) TURB specimens and B) cystectomy specimens. Dichotomization into high and low expression was based on median values. Number at risk demonstrates the number of patients at risk of recurrence of muscle invasive bladder cancer at given time intervals during follow-up.