Figures & data
Figure 1. Comparison of T cell repertoire metrics between patients with cancer and healthy individuals.
Clonality index with mean ±SEM of PB TCR repertoire of patients with hemC (n = 70) compared to age-matched HDs (n = 68) (a) and patients with solC (n = 89) compared to age-matched HDs (n = 58) (b). Shannon diversity index with mean ±SEM of PB TCR repertoire of patients with hemC (n = 70) compared to age-matched HDs (n = 68) (c) and patients with solC (n = 89) compared to age-matched HDs (n = 58) (d). Statistical test: unpaired two-sided t-test.
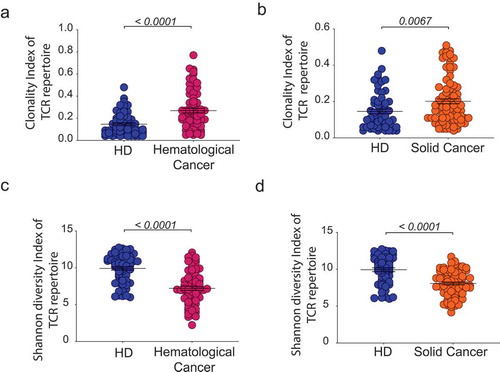
Figure 2. Age-dependent TCR repertoire clonality in healthy individuals and patients with cancer.
Clonality index with mean ±SD of PB TCR repertoire of HD, solC and hemC patients, plotted according to age group (a). Mean clonal space distribution of PB TCR repertoire in HD, solC patients and hemC patients per age group (b). Clone sizes are defined as hyperexpanded (0.01 < x ≤ 1), large (0.001 < x ≤ 0.01), medium (1E-04 < x ≤ 0.001), small (1E-05 < x ≤ 1E-04). Number of individuals per age group: HD/solC/hemC, ≤30: 17/5/9, 31–40: 14/8/3, 41–50: 15/14/8, 51–60: 16/28/15, 61–70: 16/23/24, ≥70: 17/29/37. Statistical test: unpaired, two-sided t-test between two subgroups, Pearson correlation between age and clonality index.
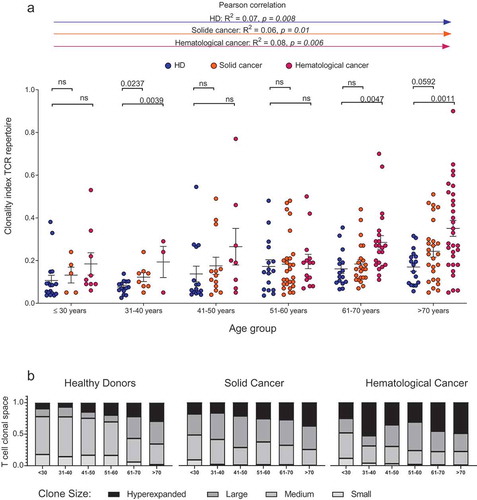
Figure 3. Age-dependent TCR repertoire diversity in healthy individuals and patients with cancer.
Shannon diversity index with mean ±SD of PB TCR repertoire of HD, solC and hemC patients, plotted according to age group (a). Mean ±SEM diversity curves of PB TCR repertoire in HD, solC patients and hemC patients per age group (b). Grey boxes indicate alpha = 1 resembles Shannon Index, alpha = 2 resembles Simpson´s Index. Number of individuals per age group: HD/solC/hemC, ≤30: 17/5/9, 31–40: 14/8/3, 41–50: 15/14/8, 51–60: 16/28/15, 61–70: 16/23/24, ≥70: 17/29/37. Statistical test: unpaired, two-sided t-test between two subgroups, Pearson correlation between age and Shannon index.
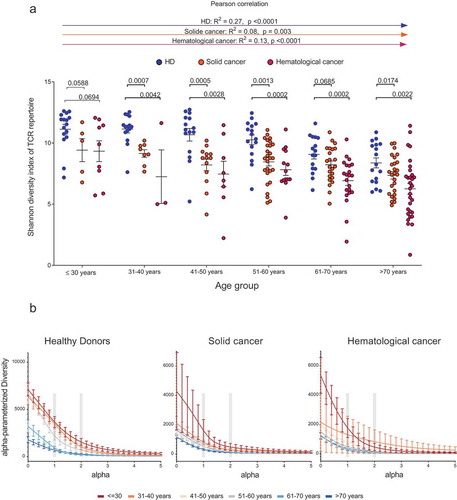
Figure 4. Correlation between age and TCR repertoire evenness/richness.
Pearson correlation between age [years] and T cell repertoire evenness in HD (a), hemC (c) and solC (e) patients. Pearson correlation between age [years] and T cell repertoire richness in HD (b), hemC (d) and solC (f). Black line indicates regression model.
![Figure 4. Correlation between age and TCR repertoire evenness/richness.Pearson correlation between age [years] and T cell repertoire evenness in HD (a), hemC (c) and solC (e) patients. Pearson correlation between age [years] and T cell repertoire richness in HD (b), hemC (d) and solC (f). Black line indicates regression model.](/cms/asset/ae130e60-763a-4c50-8159-10dbc2923383/koni_a_1644110_f0004_oc.jpg)
Figure 5. Effect of chemotherapy on T cell diversity in cancer patients.
Shannon diversity index with mean ±SEM of PB TCR repertoire of untreated and chemotherapy treated age-matched solC (n = 5) and hemC (n = 16) patient samples (a) and of paired solC (n = 12) and hemC (n = 17) patient samples before and after chemotherapy (b). Mean ±SEM diversity curves of PB TCR repertoire of untreated and chemotherapy treated samples from hemC patients (n = 16 + 17) (c) and solC patients (n = 5 + 12) (d). Statistical test: unpaired, two-sided t-test.]
![Figure 5. Effect of chemotherapy on T cell diversity in cancer patients.Shannon diversity index with mean ±SEM of PB TCR repertoire of untreated and chemotherapy treated age-matched solC (n = 5) and hemC (n = 16) patient samples (a) and of paired solC (n = 12) and hemC (n = 17) patient samples before and after chemotherapy (b). Mean ±SEM diversity curves of PB TCR repertoire of untreated and chemotherapy treated samples from hemC patients (n = 16 + 17) (c) and solC patients (n = 5 + 12) (d). Statistical test: unpaired, two-sided t-test.]](/cms/asset/821706cd-498e-48b0-a9d7-ce425d34c325/koni_a_1644110_f0005_oc.jpg)
Figure 6. Effect of chemotherapy on T cell clonality in cancer patients.
Clonality index with mean ±SD of PB TCR repertoire of untreated and chemotherapy treated age-matched solC (n=5) and hemC (n=16) patient samples (a) and of paired solC (n=12) and hemC (n=17) patient samples before and after chemotherapy (b). Mean clonal space distribution of PB TCR repertoire of untreated and chemotherapy treated samples from solC patients (n=5+12) and hemC patients (n=16+17) (c). Clone sizes are defined as hyperexpanded (0.01 < x ≤ 1), large (0.001 < x ≤ 0.01), medium (1E-04 < x ≤ 0.001), small (1E-05 < x ≤ 1E-04). Statistical test: unpaired, two-sided t-test.
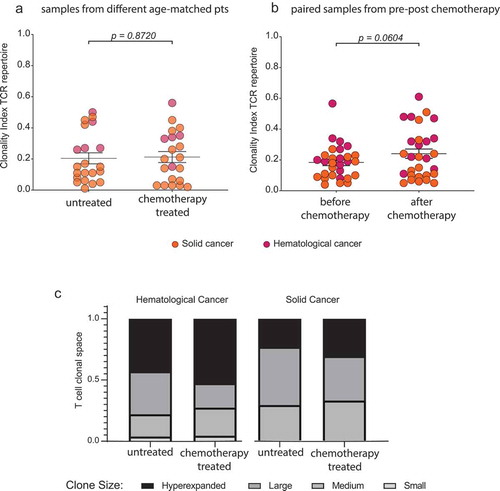
Figure 7. T cell repertoire overlap in healthy individuals and patients with cancer pre and post chemotherapy.
TCR repertoire overlap matrix based on CDR3 amino acid sequence of long-term follow-up samples of HD (n = 4) (indicated by year dates) and of paired solC patient (n = 17) and hemC patient (n = 12) samples before and after chemotherapy, respectively. CDR3 – complementarity determining region 3
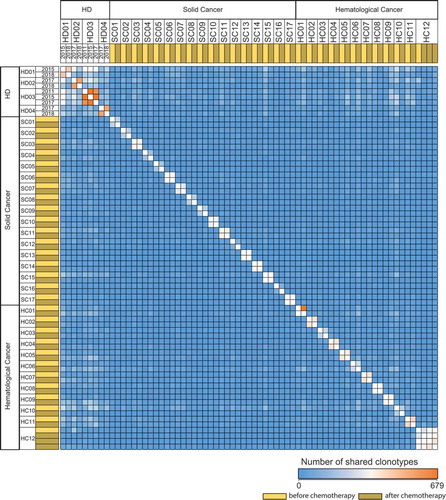
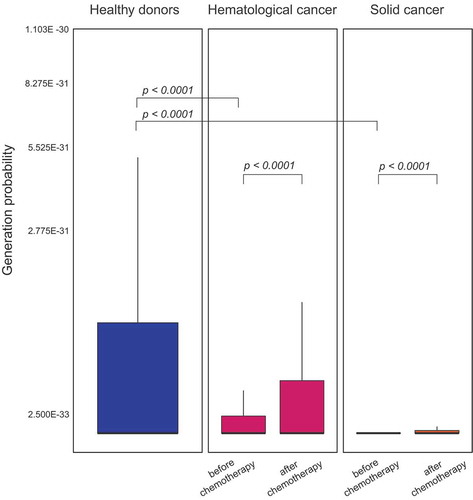
Figure 8. Generation probability of TCR repertoires.
Boxplot of generation probability of long-term follow-up TCR repertoire of HD (n = 4) and paired samples of patients with hemC (n = 12) and patients with solC (n = 17) before and after chemotherapy, respectively. Statistical test: Wilcoxon test.