Figures & data
Figure 1. Differential expression of annexin A1 (ANXA1) in different public transciptome datasets. CA, cancer tissue, N, normal tissue. p values are based on one-sided t-test.
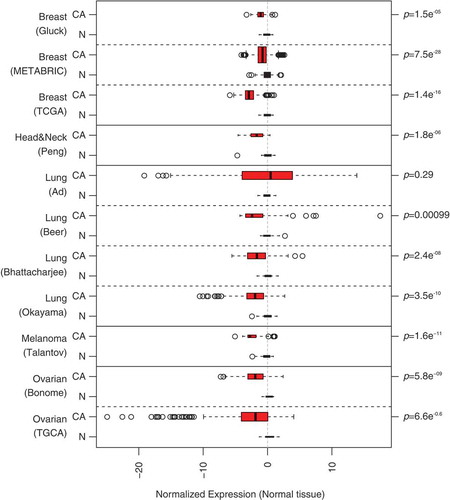
Figure 2. Wild type (WT), Annexin A1 (AnxA1−/-), Formyl peptide receptor 1 (Fpr1−/-) and mitochondrial methionyl-tRNA formyltransferase (Mtfmt−/-) deficient murine MCA205 fibrosarcome (a) and non small cell lung cancer TC-1 (b) cells were left untreated (Co) or treated with mitoxantrone (MTX) or doxorubicin (DOXO), at the indicated doses, for 18 h, followed by the cytofluorometric assessment of cell death parameters upon co-staining with fluorescein isothiocyanate (FITC-AnnexinV) and the vital dye 4ʹ,6-diamidino-2-phenylindole (DAPI).
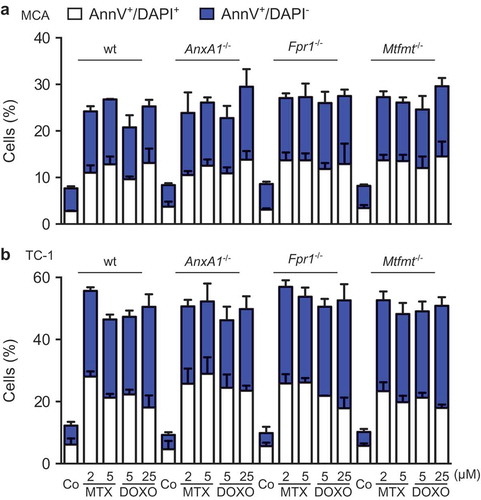
Figure 3. (a) Wild type (WT), Annexin A1 (AnxA1−/-), Formyl peptide receptor 1 (Fpr1−/-) and mitochondrial methionyl-tRNA formyltransferase (Mtfmt−/-) deficient murine MCA205 fibrosarcoma cells were left untreated (Co) or treated with 2 μM mitoxantrone (MTX), 25 or 20 µM doxorubicin (DOXO) for 18 and 24 h, respectively, followed by the assessment of extracellular ATP by means of a luciferase-based assay. (b) WT, AnxA1−/-, Fpr1−/-, and Mtfmt−/- murine MCA205 cells were treated with 2 μM MTX or 20 µM DOXO for 24 and 48 h or left untreated (Co) and then subjected to the assessment of extracellular high mobility group box 1 (HMGB1) by ELISA. Data are represented as mean ± SD. Results from one representative experiment out of three independent ones yielding similar results are reported. (c) Heatmap representing the levels of the interferon (IFN) stimulated-genes in WT and Anxa1−/- MCA cells treated with DOXO. *p < 0.05, **p < 0.01, ***p < 0.001, ****p < 0.0001 as compared to PBS-treated cells of the same type. #p < 0.05, ##p < 0.01, ###p < 0.001, ####p < 0.0001 as compared to WT cells.
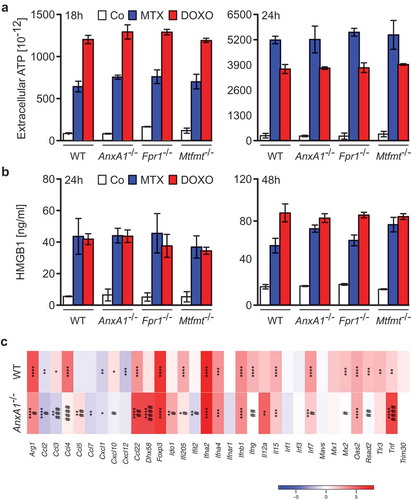
Figure 4. Wild type (wt), Annexin A1 (AnxA1−/-), Formyl peptide receptor 1 (Fpr1−/-) and mitochondrial methionyl-tRNA formyltransferase (Mtfmt−/-) deficient murine MCA205 fibrosarcoma (a,c) or TC-1 non small cell lung carcinoma (b,d) cells were treated with phosphate-buffered saline (PBS), 2 μM mitoxantrone (MTX), 25 or 20 µM doxorubicin (DOXO) for 18 and 24 h, respectively. Cells were subsequently assessed by cytofluorometric immunodetection of calreticulin (CALR) exposure. Results from one representative experiment out of three independent ones yielding similar results are reported in (b,d). Data are represented as mean ± SD. Representative cytofluorometric profiles for one sample out of three independent ones belonging to at least 3 independent experiments are reported in (a,c). **** p < 0.0001 (unpaired Student’s t test), as compared to PBS-treated cells. #### p < 0.0001 (unpaired Student’s t test), as compared to CALR exposure in WT cells. Immunobloting (e) and quantification ((f), mean ± SEM, n = 2) for CALR in MCA205 and TC-1 WT or AnxA1−/- cells. * p < 0.05, ** p < 0.01 (unpaired Student’s t test), as compared to WT cells. PI, Propidium iodide.
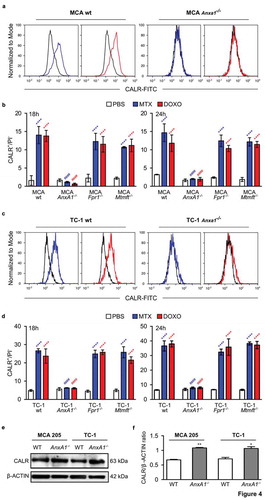
Figure 5. (a,c) Wild type (WT) immunocompetent C57BL/6 mice were inoculated subcutaneously (s.c.) with Annexin A1 deficient (AnxA1−/-) murine MCA205 fibrosarcoma (a) or TC-1 non small cell lung cancer cells (c), respectively. (b,d) Formyl peptide receptor 1 knock out (Fpr1−/-) mice were inoculated s.c. with WT murine MCA205 fibrosarcoma (b) or TC-1 cells (d), respectively. Tumor size was routinely assessed. When tumor became palpable, mice received intratumorally (i.t.) either recombinant calreticulin (rCALR) or doxorubicin (DOXO), alone or in combination or an equivalent volume of phosphate-buffered saline (PBS). From left to right: (1) average (±SEM) tumor growth curves from one representative experiment of two; (2) tumor size distribution at day 25 (MCA205 Anxa1−/-, (a)), day 24 (MCA205 WT, (b)), day 21 (TC-1 Anxa1−/-, (c)) or day 18 (TC-1 WT, (d)) of data shown in (1); (3) individual growth curves from mice injected with DOXO alone or combined with rCALR. ****p < 0.0001, as compared to PBS-treated tumors; $$$$p < 0.0001, as compared to DOXO-treated tumors; #p < 0.0001, as compared to rCALR-treated tumors.
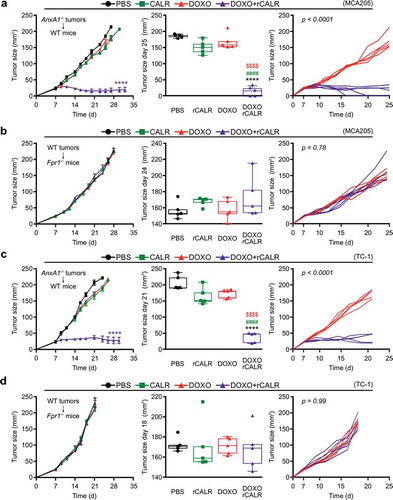
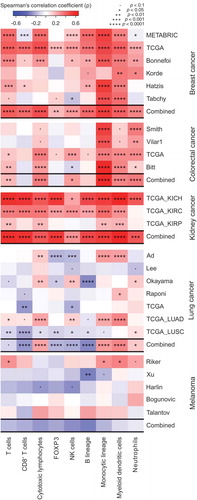
Figure 6. Spearman’s correlation coefficients between immune infiltrate estimates (MCP-counter method) and Annexin A1 (ANXA1) mRNA levels from different public datasets, of breast, colorectal, kidney and lung cancer, and melanoma. For each cancer, a combined p value has been calculated as described in Materials and Methods.