Figures & data
Figure 1. Primary EOC cells as cellular basis for the establishment of physiological EOC mouse model. (a) Primary EOC cells (pEOC originated from either primary solid tumor (CKT), carcinomatosis (CKC), or ascites (CASC); light blue symbols) and cell lines (cEOC; dark blue symbols) were sensitized (filled symbols), or not (empty symbols), with zoledronate overnight before a 4h-coculture with human allogeneic Vγ9Vδ2 T lymphocytes (ET ratio 1). Expression of CD107a was analyzed on γδ T lymphocytes by flow cytometry. Results are expressed as percentage (%) of CD107a+ cells among Vδ2+ T lymphocytes (n = 4, each point correspond to different donors of Vγ9Vδ2 T lymphocytes). (b-c) Design of orthotopic engraftment of human EOC cells in the ovary of NSG mice and analysis. Six months after injection, ovaries were collected, fixed, sectioned and stained with anti-human MHC class I mAb. (c) Representative stained sections of NSG mice ovaries engrafted with three different primary EOC cells (from three different patients).
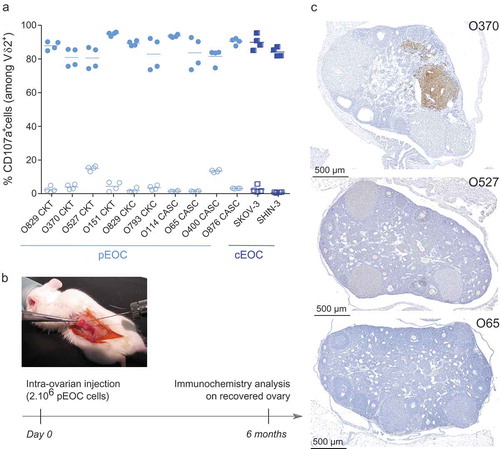
Figure 2. Establishment of a preclinical orthotopic human EOC mice model. (a) Representative optical and bioluminescence pictures showing the chronological development of orthotopic EOC xenografts (pictures 1 to 5) and subsequent peritoneal carcinosis (pictures 6 to 10) in NSG mice. (b) Bioluminescence analysis of mice performed at day 45 after tumor resection in surgery (surgery alone) or surgery combined to intraperitoneal injection of chemotherapy at days 10, 12, 14 and 16 after surgery (surgery + chemotherapy) (n = 10 mice; **** p < 0.0001). Results are expressed as cpm/cm2. (c) Survival curves of mice treated by surgery alone (-■-) or surgery and chemotherapy (-■-) (n = 10 mice per group; Log rank analysis, **** p < 0.0001).
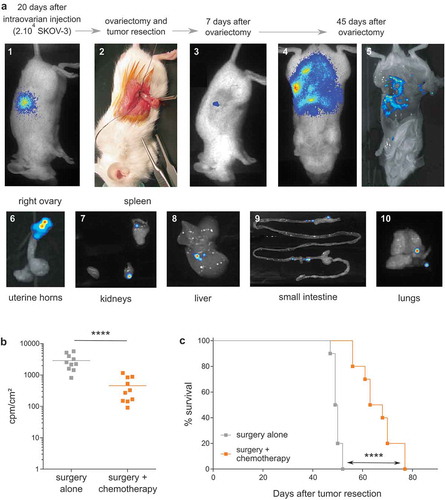
Figure 3. Zoledronate is essential to efficiently sensitize human EOC tumor cells to Vγ9Vδ2 T lymphocyte recognition in vitro and in vivo. (a) Reactivity and cytotoxicity of allogeneic human Vγ9Vδ2 T lymphocytes against human EOC cells. In reactivity (CD107a) and cytotoxicity (51Crrelease) assays, SKOV-3 cells were sensitized by zoledronate overnight before a 4 h-coculture with human allogeneic Vγ9Vδ2 T lymphocytes performed at ET ratio 1 (-□-) and 10 (-●-). Results are expressed as % of CD107a+ cells among Vδ2+ T lymphocytes and % cytotoxicity (mean ± SD; n = 4), respectively. (b-c) Vγ9Vδ2 T lymphocytes were intraperitoneally injected, with or without zoledronate, in SKOV-3 tumor-bearing NSG mice. After peritoneal wash, CD69 expression was analyzed on Vδ2+ T lymphocytes. Representative histogram (b) or compiled results (c) of CD69 expression on Vγ9Vδ2 T lymphocytes (n = 5; *** p < 0.001).
Figure 4. Paclitaxel alters the reactivity of Vγ9Vδ2 T lymphocytes by inducing a decrease of the expression of adhesion molecules on tumor cells. (a-b-c) SKOV-3 cell lines were treated for 1 h with the following chemotherapies: Paclitaxel alone (Pacli), Carboplatin alone (Carbo), or both (Pacli + Carbo). After zoledronate sensitization performed at different concentrations: without (a), ED50 (b) or ED100 (c), tumor cells were co-cultured for 4 h with Vγ9Vδ2 T lymphocytes (ET ratio 1) which were analyzed for expression of CD107a by flow cytometry. Results are expressed as % of CD107a+ cells among Vδ2+ T lymphocytes (n = 4; * p < 0,05). (d) SKOV-3 cells were stained with Zombie Green and Vγ9Vδ2 T lymphocytes were stained with anti-Vδ2 mAb before incubation during 30 min and flow cytometry analysis. % double positive events were recovered and results are expressed as fold change relative to the none condition (n = 4; * p < 0,05). (e) Representative histograms of extracellular staining of CD54 (left) CD166 (middle) and CD44 (right) on SKOV-3 cells after chemotherapeutic treatments.
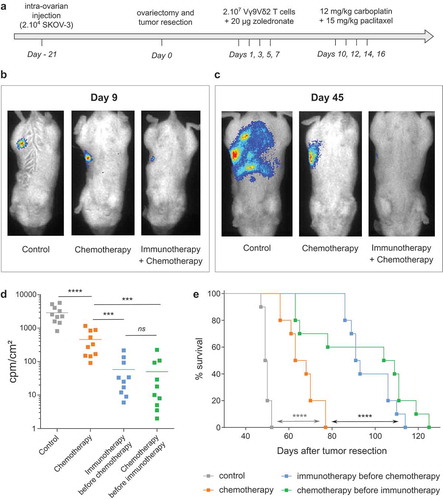
Figure 5. in vivo combination of chemotherapy and immunotherapy strongly improves EOC mice survival. (a) Design of the trial. (b-c) Representative bioluminescence pictures of one mice per group at day 9 (b) and day 45 (c) after tumor resection. (d) Compiled results of bioluminescence intensities for each group. (n = 10 mice; *** p < 0.001). (e) Survival curves of control mice (-■-), mice treated by chemotherapy (-■-), immunotherapy before chemotherapy (-■-) or chemotherapy before immunotherapy (-■-) (n = 10 mice per group; Log rank test, **** p < 0.0001).