Figures & data
Table 1. Patient demographics and baseline disease characteristics (N = 37 patients).
Figure 1. Correlation of T-cell repertoire characteristics of pre-treatment tumor specimens with clinical outcomes. (a) and (b) T-cell clonality and T-cell fraction stratified by responders (CR/PR) and non-responders (SD/PD). (c) and (d) T-cell clonality and T-cell fraction stratified by disease control (CR/PR/SD) and disease progression (PD).
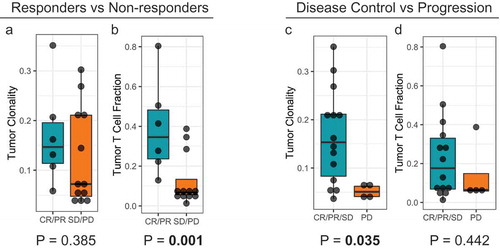
Figure 2. Kaplan-Meier survival plots showing (a) PFS and (b) OS comparing patients with higher (> 0.12) or lower (< 0.12) tumor TCR clonality at baseline.
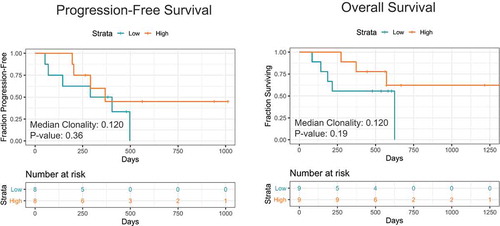
Figure 3. Peripheral T-cell clonality of all patients separated by clinical outcomes and time point. (a) Peripheral T-cell clonality stratified by responders (CR/PR) and non-responders (SD/PD). (b). Peripheral T-cell clonality stratified by disease control (CR/PR/SD) and disease progression (PD).
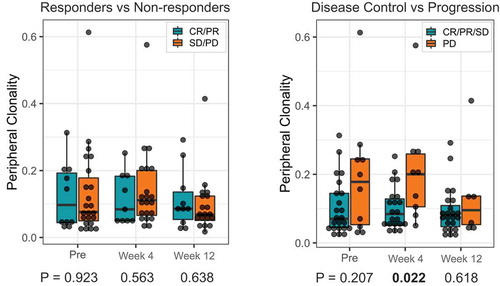
Figure 4. Kaplan-Meier survival plots showing PFS and OS comparing patients with higher or lower median TCR clonality at baseline, week 4 and week 12.
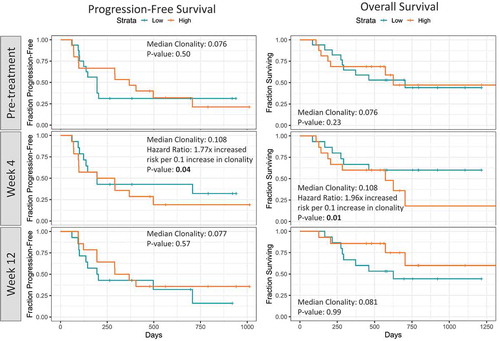
Figure 5. (a) T-cell Repertoire turnover at week 4 and week 12 relative to baseline stratified by clinical response; (b) T-cell clonal expansion at week 4 and week 12 relative to baseline stratified by clinical response; (c) Tumor-infiltrating lymphocytes (TILs) clonal expansion at week 4 and week 12 stratified by clinical response.
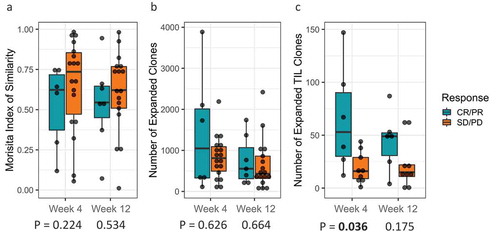
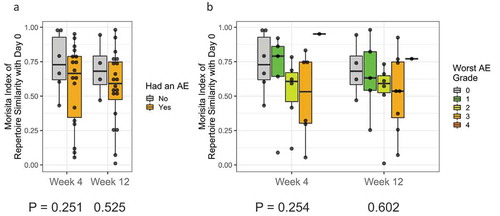
Figure 6. (a) T-cell Repertoire turnover relative to baseline at week 4 and week 12 stratified by presence or absence of adverse event; (b) T-cell Repertoire turnover relative to baseline at week 4 and week 12 stratified by severity of adverse event.