Figures & data
Table 1. Univariate and multivariate analysis of factors associated with survival and recurrence.
Figure 1. Expression and clinical significance of CD47 in HCC.
(a) Representative microphotographs of CD47 immunostaining in HCC tissues. The H-score = 11.0 was applied to divide patients with low and high CD47 expression. The scale bar indicates 50 μm (red arrows represent parenchymal cells, blue arrows represent endothelial/immune cells, green arrows represent erythrocytes). (b) Kaplan–Meier plots of overall survival (OS) and recurrence-free survival (RFS) rates of HCC patients stratified by CD47 expression. P value was calculated by the log-rank test. (c-d) qPCR and western blot demonstrated CD47 expression in a variety of hepatoma cell lines. (e-g) Hep3B and PLC tumor cells were labeled with CFSE and cultured with monocyte-derived-macrophages from human peripheral blood. The cells were incubated with IgG or CD47 blocking antibody; 200× magnification images of the cell are shown. Incubation with blocking anti-CD47 antibodies resulted in increased phagocytosis of CFSE-labeled Hep3B and PLC cells (arrows).
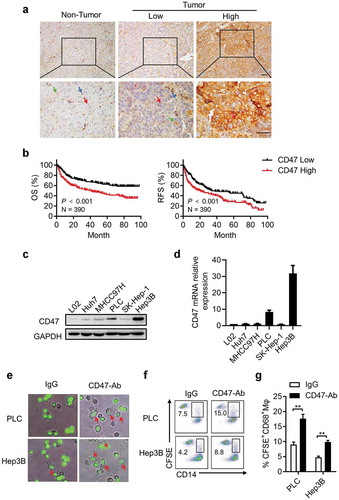
Figure 2. Mφs regulates CD47 expression on hepatoma cells.
(a) Representative microphotographs of CD47 expression and CD68+ Mφs accumulation in HCC tumor tissue. The scale bar indicates 50 μm. (b) Correlation between CD47 expression level and the number of Mφs. Data from 181 HCC patients shown as mean ± SEM. **** p < .0001. (c-d) Tumor cells were cultured for 48 h in conditioned medium from control Mφs (CCM) or medium from TSN-exposed Mφs (TCM). qPCR and western blot were applied to detect the CD47 expression. Data from three independent experiments shown as mean ± SEM. * p < .05. (e-f) Representative FACS analysis and summary of tumor cell phagocytosis by Mφs after treatment with CCM or TCM. Data from three independent experiments shown as mean ± SEM. ** p < .01.
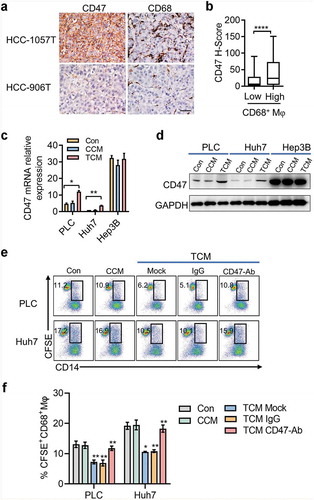
Figure 3. IL-6 derived from tumor-activated Mφs (TAMs) is responsible for CD47 upregulation on hepatoma cells.
(a) Cytokine level of macrophages secreted after no treatment or cultured with the supernatant from Huh7 and PLC cells (TSN) for 48 hours. (b-c) PLC and Huh7 were incubated for 48 h with a concentration gradient of rhTNF-α, rhIL-1β, rhIL-6, or rhIL-10, and the CD47 expression on tumor cells was determined by qPCR and western blotting. Data from three independent experiments shown as mean ± SEM. * p < .05; ** p < .01; *** p < .001. (d-e) PLC and Huh7 cells were cultured in TCM and mAb against indicated blocking antibodies, and the CD47 expression on tumor cells was determined by qPCR and western blotting. Data from three independent experiments shown as mean ± SEM. * p < .05. (f-g) mRNA level of CD47 expression in PLC and Huh7 cells cultured in TCM and tocilizumab (5 µg/mL). Data from three independent experiments are shown as mean ± SEM. * p < .05. Western blot of PLC and Huh7 cells for CD47 expression after treatment with TCM or tocilizumab (5 µg/mL). One of three independent experiments is shown. (h-i) PLC and Huh7 cells were cultured with Mφs after treatment with IL-6 for 48 h. The percentages of phagocytosis were determined by FACS. Statistical analysis of at least three independent experiments shown as mean ± SEM. * p < .05; ** p < .01. (j-k) Representative FACS data and statistical analysis of tumor cell phagocytosis by Mφs treated with TCM or IL-6 blocking antibody or tocilizumab. Data from three independent experiments shown as mean ± SEM. ** p < .01.
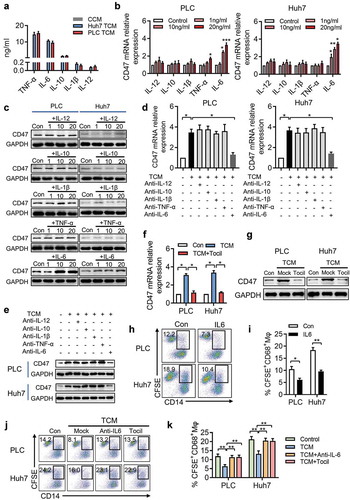
Figure 4. STAT3 signaling is essential for IL-6-induced CD47 expression in HCC.
(a) p-STAT3 and total STAT3 protein levels were assessed by western blotting. One of three representative experiments is shown. (b-c) PLC and Huh7 were cultured with IL-6 or TCM and STAT3 inhibitor NSC74859 (50 µM). CD47 expression was determined by qPCR. * p < .05; ** p < .01. (d) Western blot detected the CD47 level of PLC and Huh7 cells treated with IL-6 or TCM and STAT3 inhibitor NSC74859 (50 µM). (f-g) FACS analysis and summary of tumor cell phagocytosis by macrophages after treatment with IL-6 or TCM and NSC74859. * p < .05; ** p < .01. (h) Representative microphotographs of CD47 expression and p-STAT3+ cells in HCC tumor tissue. The scale bar indicates 50 μm. (i) The CD47 expression level was positively correlated with the density of p-STAT3+ cells. ****p < .0001.
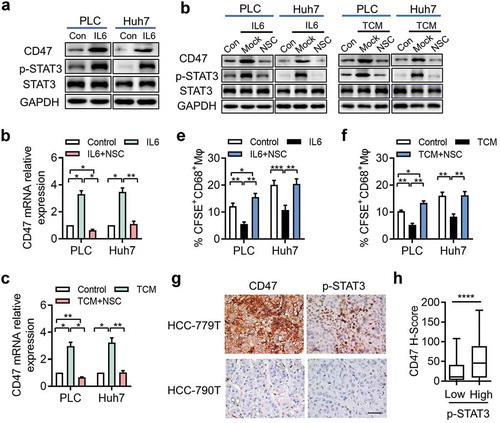
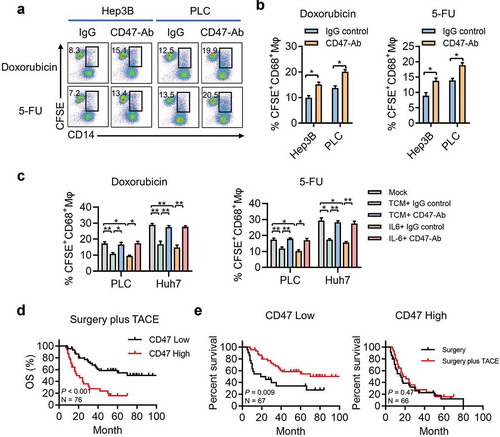
Figure 5. CD47 expression on hepatoma cells decreases the efficacy of TACE.
(a) Representative FACS analyses of tumor cell phagocytosis by Mφs when treated with IgG or CD47 blocking antibody and doxorubicin or 5-FU. (b) Summary of (a). Data from three to six independent experiments shown as mean ± SEM. * p < .05; ** p < .01. (c) FACS analysis and summary of tumor cell phagocytosis by Mφs after treatment with IL-6 or TCM and doxorubicin or 5-FU. * p < .05; ** p < .01. (d) Kaplan–Meier plots of the overall survival rate of HCC patients who developed recurrent HCCs and received post-operative TACE treatment stratified by CD47 expression. P value was calculated by the log-rank test. (e) Kaplan–Meier plots of overall survival rate of HCC patients who developed recurrent HCCs and did or did not received post-operative TACE treatment in the CD47low or CD47high group . P value was calculated by the log-rank test.